Latest news

Execution Gap
Every CMO knows what campaign they want to run. The strategy is ready on day one.
What kills it is everything between the brief and the launch. A brief goes to the agency, the agency comes back with creative, the creative goes back for revisions, and then it's media buying and legal review and another round of notes and a reshoot and finally – six weeks after someone had the idea – the ads go live. The moment's gone. The market moved. The insight that sparked the campaign is stale.
This is the execution gap. And every marketing org in the world is trapped in it.
It's not a people problem. The people are great. It's an output problem that everyone has been solving by hiring more people. The 500-person marketing org wasn't built because marketing is intrinsically a 500-person job. It was built because execution used to be time consuming.
Launching a campaign shouldn't be this hard. We know because we've watched it get easy somewhere else.
Agents work for engineering. Engineers hand off tickets and come back to working code that actually merges. Nothing else does. Every other agent product is a demo that falls apart the second you try to use it in production. Same underlying models, same capabilities, totally different outcome. The gap isn't the model: it's the context.
A codebase is a complete world an agent can reason over. Types, tests, imports, git history. Without meaning to, programmers built the first real ontology: a machine-readable map of every entity, every relationship, every rule that governs how the system works. Hand an agent a codebase and every fact it needs is already there.
Hand an agent a marketing team and it's working blind.
The customer insights are in Gong. The campaigns are in HubSpot. The pipeline is in Salesforce, which everyone treats as the source of truth even though 80% of the actual customer relationship lives somewhere else entirely – in a Slack thread from three months ago, in an email nobody remembers, in a product analytics tool three people on the team have access to. That's why every "AI for marketing" product you've seen is a demo. The models are fine. The context is broken.
We fixed the context.
Lantern is the first revenue ontology platform. We unify every piece of customer data across every system your company runs – first party, third party, structured, unstructured – into a single machine-readable graph. Then we put agents on top of it. Not one agent pretending to be a marketer, but a library of them, each built for a specific piece of the work.
I wrote the long-form argument for why ontology is the whole ballgame last week. If you want the technical foundation, it's here. This post is about what happens once you have it.
Give Lantern a brief and it comes back with the campaign. In 10 minutes or less. Ads, landing pages, email sequences, social, competitive teardowns, the whole thing. Not a draft – a shipped campaign, on-brand and in most cases better than what your current team would produce because it can reach context your current team can't.
We're working with a Fortune 500 company whose marketing department has more than 3,000 people. During the pilot, leadership asked us not to present the work to the marketing team. Not because the work was bad. Because it was too good – and they hadn't decided what kind of organization they wanted to be on the other side.
That's the decision every B2B marketing org is about to face. Not whether this technology works. It works. The decision is what you do with it.
Path one: use it to cut. Shrink the team, pocket the savings, keep running the same campaigns with fewer people. The budget that used to pay for execution now goes into channels. Some companies will do this; Dorsey laid off 50% of Square employees last month.
Path two: use it to attack. Keep your best people – the strategists, the creatives, the operators who actually understand your market – and unleash them. Launch 10x more campaigns. Personalize every one of them. Run the wild ideas that used to die in prioritization because they were too expensive, too ambitious, too operationally complex. The hours that used to go into building campaigns now go into imagining better ones.
We are about to enter the golden age of marketing. More creative. More ambitious. More personal. "It costs too much, it's too ambitious, it takes too much time" – those are complaints of the past.
To every CMO in the global 2000: you need to decide which path you're on. The companies that move first get to choose how this lands. The companies that wait get the decision made for them.
You don't have to believe me.
Text +1 (650) 222-1296 and chat with a Lantern agent.

Why Your Active Deals Are Sending Buying Signals You're Missing
When a sales cycle stalls, most teams blame external factors: budget constraints, changing priorities, or competitive pressure. What if the real culprit is simpler and more fixable? What if your prospects are actually signaling their continued interest—but your team is missing these critical signals?
The Invisible Intent Gap in Active Sales Cycles
Most sales teams are laser-focused on traditional engagement metrics: email opens, meeting attendance, and CRM activity. Meanwhile, 70% of actual buying intent signals occur outside these tracked channels, creating a dangerous blind spot for deals already in your pipeline.
Consider this scenario: Your champion hasn't responded to emails in two weeks, but three other stakeholders from the account have visited your pricing page seven times in the past 48 hours. Without this intelligence, your rep might be ready to mark the opportunity as "at risk"—exactly when the buying committee is showing peak interest.
The Three Critical Moments Most Teams Miss
1. The Technical Deep Dive
When technical stakeholders return to product pages after formal demos, it signals serious evaluation. Research shows that 83% of technical validation happens independently, without the sales rep's knowledge.
These self-guided technical explorations often predict deal momentum better than meetings or email interactions. When a prospect's engineering team spends 45 minutes on your API documentation after an initial call, they're not casually browsing—they're validating your solution against requirements.
2. The Price Check Signal
The most revealing signal of all? Return visits to pricing pages. When multiple stakeholders from an active opportunity repeatedly view pricing information, they're typically:
Preparing budget justification
Comparing different tiers or packages
Building internal business cases
Preparing for negotiation
Yet most companies have no visibility into this behavior until it's too late to capitalize on the momentum.
3. The Silent Researcher
A particularly valuable signal comes from what we call "The Silent Researcher"—a stakeholder who never appears on calls but extensively researches your solution. Often, this person is:
The economic buyer who stays behind the scenes
A technical evaluator conducting due diligence
A procurement specialist preparing for negotiations
Without proper intent tracking, these invisible but crucial decision-makers remain undetected throughout the sales process. When they eventually surface with objections or requirements, sales teams are caught completely off-guard.
The Revenue Impact of Missed Signals
The financial consequences of missed intent signals in active opportunities are substantial:
Deal velocity slows by 37% when teams fail to respond to buying intent signals within 24 hours
Win rates decrease by 23% for opportunities where technical stakeholder research goes unnoticed
Deal size shrinks by 18% when pricing exploration signals aren't leveraged for upsell conversations
These aren't small efficiency gains—they represent fundamental revenue leakage in your sales process.
From Reactive to Proactive Opportunity Management
Forward-thinking teams are moving beyond basic pipeline management to dynamic opportunity intelligence. This shift involves:
Comprehensive signal tracking across your entire digital ecosystem
Real-time alerts when key stakeholders engage with critical content
Contextual intelligence that maps engagement to specific buying stages
Prescriptive next steps based on the type and intensity of signals
When a technical stakeholder revisits your security documentation, the ideal response isn't the same as when the economic buyer reviews pricing options. Different signals demand different selling motions.
Lantern's Open Opps Intel: Turning Signal Detection into Revenue
This is precisely why we built Lantern's Open Opps Intel agent. It tracks when contacts from active opportunities interact with your critical selling resources, providing immediate alerts and actionable context to your team.
The agent not only captures the "who" and "what" of engagement but also interprets the buying intent behind each interaction. By analyzing behavioral patterns across the entire buying committee, it helps reps understand:
Which deals show true momentum vs. which are stalling
Which stakeholders are actively researching your solution
Which content is resonating with technical vs. economic buyers
Which objections are likely being researched behind the scenes
Sales teams using Lantern's Open Opps Intel report:
28% acceleration in deal velocity for active opportunities
41% improvement in accurately forecasting deal close dates
19% increase in average deal size through better timing of upsell conversations
From Data to Action: What This Means for Your Team
With proper intent signal detection, your team can transform their selling approach:
1. Timing-Based Outreach
When a prospect shows renewed interest after a period of silence, that's the optimal moment for re-engagement—not the arbitrary "checking in" emails most reps send on a predetermined schedule.
2. Content-Based Personalization
If a technical stakeholder downloads your security whitepaper, your next communication should address those specific concerns—not generic value propositions.
3. Multi-Threaded Engagement
When new stakeholders from an account begin researching your solution, it's time to expand your selling motion to include them—even if your champion hasn't made the introduction.
4. Priority-Based Time Allocation
Not all opportunities deserve equal attention. When multiple stakeholders from an account show intense research activity, that opportunity should immediately rise to the top of your rep's priority list.
Conclusion: The Future of Intent-Based Selling
The most sophisticated sales organizations are no longer simply "working their pipeline"—they're orchestrating precise responses to buyer signals across their entire opportunity landscape.
By implementing Lantern's Open Opps Intel agent, teams gain the ability to:
See exactly which active deals are showing genuine buying momentum
Identify the specific stakeholders actively engaged in the buying process
Understand which content and topics are driving buying decisions
Time their outreach to perfectly align with peaks in buyer interest
In the age of digital buying, the winners won't be those who simply work harder—it will be those who can interpret and act on the intent signals their prospects are already sending.
Interested in learning how Lantern's Open Opps Intel agent can transform your team's ability to capitalize on buying signals from active opportunities? Book a demo today to see the power of AI-driven intent tracking in action.

What Is Signal-Based Selling? From Traditional to AI-Powered Revenue
Your prospects? They're drowning in a tsunami of 150+ cold emails. Every. Single. Day.
Customer acquisition costs? Through the roof.
But here's the plot twist – a new hero has emerged in the B2B sales world: signal-based selling.
Think of it as your sales team's secret weapon. No more spray and pray. No more hoping for a 1% response rate.
Welcome to the era of AI-powered, laser-focused sales intelligence.
Remember the evolution of music? From vinyl to Spotify? Sales has had its own revolution. We've moved from door-to-door in the '80s, to CRMs in the '90s, to today's AI-powered signal detection. It's like upgrading from a flip phone to the latest iPhone – there's just no comparison.
But what exactly is signal-based selling? Imagine having a crystal ball that tells you exactly when a prospect is ready to buy. That's what we're talking about. Instead of cold calling hundreds of uninterested prospects, you're focusing on the ones actually raising their hands – virtually, of course.
Here's where it gets exciting: modern platforms can track buying signals across more than 30 different tools.
Website visits? Tracked.
Product usage patterns? Monitored.
Job changes? Flagged.
It's like having a team of digital detectives working 24/7 to spot your next best opportunity...Let's dive in!
Why Traditional Outbound Sales Is No Longer Effective
The traditional outbound sales model is breaking down for several critical reasons. The statistics paint a stark picture of the current situation, revealing three major challenges that are reshaping the sales landscape.
Email saturation has reached unprecedented levels in today's digital environment. Decision-makers are now drowning in their inboxes, receiving over 150 cold emails weekly. This overwhelming volume has led to dramatically diminished effectiveness, with average cold email response rates plummeting to a mere 1%. The constant barrage of unsolicited messages has created severe inbox fatigue, resulting in increased buyer resistance and rapidly eroding trust in traditional outreach methods.
The financial impact of traditional sales approaches has become increasingly unsustainable. Customer acquisition costs (CAC) have skyrocketed, showing a threefold increase over just the last two years. Organizations are finding themselves trapped in a cycle of escalating investments in traditional prospecting methods, while the return on investment for cold outreach continues to decline. This cost explosion is forcing companies to reconsider their entire approach to sales and customer acquisition.
Buyer behavior has undergone a fundamental transformation. Modern B2B buyers now conduct extensive independent research before even considering engagement with sales representatives. These decision-makers have developed sophisticated expectations, demanding highly personalized interactions that demonstrate a deep understanding of their specific needs and challenges. In this environment, generic cold outreach is not just ineffective – it's often seen as intrusive and unprofessional, potentially damaging the sender's reputation and future opportunities for engagement. This shift in buyer behavior makes it clear that the era of traditional cold outreach is coming to an end, necessitating a more intelligent, signal-based approach to sales.
Types of Buying Signals in Modern B2B Sales
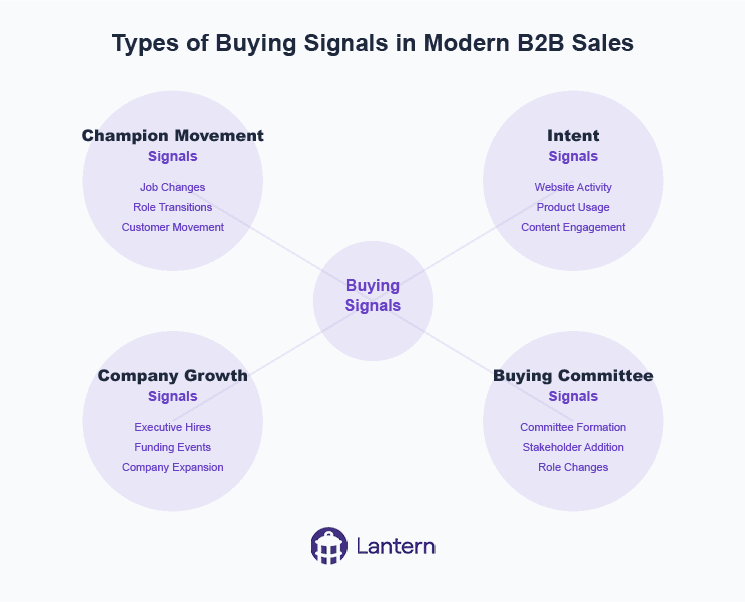
Successful signal-based selling relies on detecting and acting upon various types of buying signals. Here's a comprehensive breakdown of the key signals modern sales teams should monitor:
Champion Movement Signals
Job changes across your customer base
Former customers moving to new companies
Key contacts from closed/lost opportunities changing roles
Decision-makers taking new positions at target accounts
Champion departures that could impact current deals
Intent Signals
Website visits to pricing and product pages
Increased product usage patterns
Engagement with marketing content
Multiple stakeholders from the same company showing interest
Return visits from previously closed/lost opportunities
Demo page interactions
Company Growth Signals
New executive hires in target accounts
Funding rounds and financial events
Office expansions or new location openings
Technology stack changes
Hiring patterns in relevant departments
Buying Committee Signals
Formation of new buying committees
Additional stakeholders joining the evaluation process
Role changes within existing accounts
Missing stakeholder identification
Multi-threading opportunities
How to Implement Signal-Based Selling in Your Organization
Implementing signal-based selling requires a strategic approach and the right technological infrastructure. Success depends on a well-planned, systematic implementation that addresses four key areas of focus.
The foundation of successful signal-based selling begins with comprehensive data unification. Organizations must first connect all their customer-facing systems, including CRM, marketing automation, and product analytics platforms into a cohesive ecosystem. This integration requires establishing robust bi-directional data synchronization across platforms to ensure information flows seamlessly throughout the organization. Additionally, implementing thorough data enrichment processes ensures complete contact information is always available. The final piece of this foundation involves maintaining clean data through sophisticated duplicate prevention and standardization mechanisms, creating a single source of truth for all customer interactions.
Once the data infrastructure is in place, organizations must focus on signal definition and prioritization. This crucial phase involves carefully identifying which signals matter most for your specific business context and creating sophisticated scoring systems to evaluate different types of signals. Companies need to clearly define trigger events that require immediate action and establish comprehensive signal qualification criteria. This framework ensures that sales teams can quickly identify and act on the most promising opportunities while maintaining efficiency in their operations.
Connect your CRM, marketing automation, and product analytics into a single source of truth - then let AI detect and activate every revenue signal.
Workflow development represents the next critical phase of implementation. Organizations need to create standardized processes for signal response that can be consistently applied across the sales team. This includes setting up intelligent automated routing rules based on territories and expertise, ensuring each opportunity reaches the right team member. Comprehensive playbooks must be developed for different signal types, providing clear guidance on how to respond to each opportunity. The final piece involves implementing multi-channel activation strategies that allow teams to engage prospects through their preferred communication channels.
The final and ongoing component of successful implementation is team training and adoption. Sales teams must be thoroughly trained in signal recognition and response, ensuring they understand how to interpret and act on different types of signals effectively. Organizations should establish clear best practices for personalized outreach that align with their overall sales strategy. Creating robust feedback loops enables continuous improvement of the system, while regular monitoring and optimization of signal response rates helps maintain peak performance. This commitment to ongoing training and optimization ensures the long-term success of your signal-based selling initiative.
The Role of AI and Automation in Signal-Based Selling
Artificial intelligence has become crucial in making signal-based selling scalable and effective. Modern AI-powered systems offer several key capabilities:
Signal Detection and Processing
Automated monitoring across multiple platforms
Real-time signal detection and classification
Intelligent prioritization based on conversion likelihood
Pattern recognition for complex signal combinations
Data Enrichment and Research
Automated contact and company data enrichment
Buying committee mapping and relationship analysis
Company news and funding monitoring
Technology stack detection and analysis
Intelligent Routing and Activation
Smart territory management and lead routing
Automated workflow triggering
Multi-channel activation capabilities
Personalized outreach recommendations
Predictive Analytics
Conversion probability scoring
Opportunity value prediction
Optimal timing recommendations
Relationship strength assessment
Measuring Success in Signal-Based Selling: Key Metrics and ROI
Organizations implementing signal-based selling have reported significant improvements in key performance metrics, demonstrating the transformative impact of this approach across multiple dimensions of sales performance.
On the efficiency front, the results are compelling. Teams consistently report saving an average of 12 hours weekly on manual tracking tasks, allowing sales representatives to focus more time on meaningful customer interactions. The automation capabilities have led to a threefold increase in captured opportunities, while manual data entry and routing have been reduced by an impressive 80%*. Perhaps most significantly, teams have experienced a 70% decrease in time spent switching between tools, streamlining their workflow and improving overall productivity.
Organizations implementing signal-based selling have reported 3X more captured opportunities and 70% less time spent on manual tasks*
Performance metrics tell an equally impressive story of revenue impact and sales effectiveness. Organizations have documented a substantial 26.3% increase in sales team win rates after implementing signal-based selling strategies. Revenue has grown by an average of 9%, with many companies achieving a remarkable 6-7x ROI within just the first three months of implementation. One particularly noteworthy statistic reveals that 70% of new buyers' budgets are captured within their first 100 days, highlighting the importance of timing and rapid engagement in the modern sales landscape.
The success of signal-based selling can be tracked through several crucial key performance indicators that provide deeper insights into the methodology's effectiveness. Teams closely monitor their signal-to-opportunity conversion rates, analyzing how effectively they transform detected signals into viable sales opportunities. Response rates from signal-based outreach consistently outperform traditional cold outreach, while pipeline generation metrics help teams understand which signal types yield the best results. Time to first contact after signal detection has become a critical metric, as has the success rate of multi-threading strategies within target accounts.
Looking at the long-term impact, organizations are experiencing benefits that extend far beyond immediate sales metrics. Customer retention has improved significantly through the early detection of warning signals that allow proactive engagement before issues escalate. Companies have strengthened their competitive position through enhanced market intelligence, while more effective resource allocation has led to optimized team performance. Perhaps most importantly, teams report higher levels of satisfaction and productivity, as they spend more time on high-value activities and less on administrative tasks. This combination of immediate results and lasting organizational improvements demonstrates the comprehensive value proposition of signal-based selling as a long-term sales strategy.
The Future of Signal-Based Selling
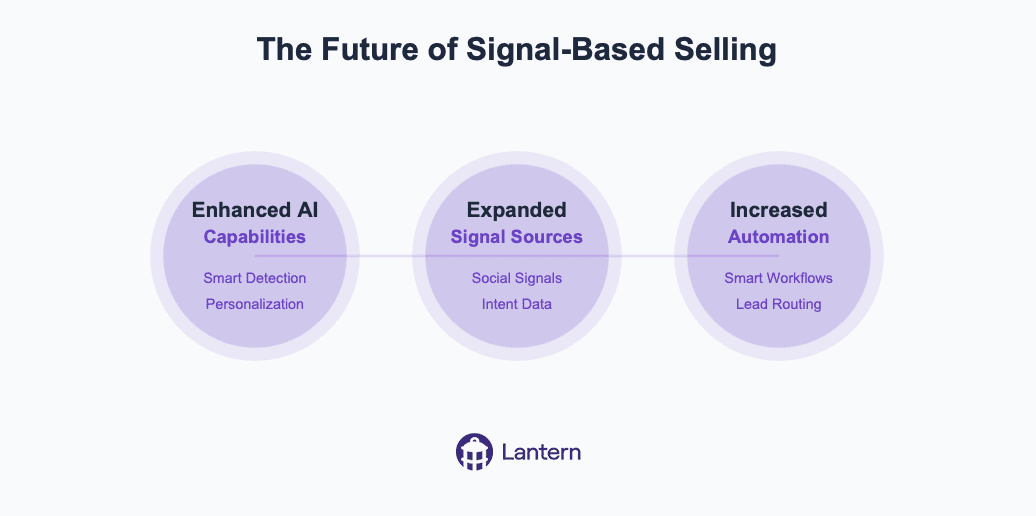
As we continue into the AI-powered, signal-based era of sales, several trends are emerging:
Enhanced AI Capabilities
More sophisticated signal detection algorithms
Improved personalization capabilities
Advanced predictive analytics
Automated research and enrichment
Expanded Signal Sources
Integration with new data sources
Enhanced social signals detection
Deeper intent data analysis
Improved buying committee mapping
Increased Automation
Automated workflow optimization
Smart playbook selection
Intelligent content personalization
Predictive lead routing
Organizations that adapt to this new approach will find themselves better positioned to succeed in an increasingly competitive marketplace. The combination of comprehensive signal detection, AI-powered intelligence, and automated workflows creates a powerful foundation for modern sales success. As technology continues to evolve, signal-based selling will become even more sophisticated, offering new opportunities for sales teams to connect with potential customers at the right time with the right message.
Ontology is all you need
Coding agents work. Not demo-work. Actually work. Engineers hand off tickets, get back working code, merge it, move on. Support agents are close behind, resolving real tickets without a human in the loop.
Everything else: demos that dazzle, pilots that fizzle, production that requires a human to redo the work. Same models, same capabilities. So what do coding and support have that nothing else does?
Most people say training data. GitHub is massive, support knowledge bases are structured, models got good at these things because they saw a lot of them. There's truth in that. But it's not the real answer.
The real answer is context. A codebase is a self-contained world. Point an agent at a repo and every fact it needs is already there. Types tell it what things are. Tests tell it what things should do. Imports tell it how things connect. Git history tells it why things changed. Without anyone intending it, programmers built a complete ontology: a machine-readable map of a small universe, its entities, their relationships, and the rules governing them.
But it gets better. A codebase also comes with a labeled training set. A Jira ticket is a prompt: here's what I want, here's the acceptance criteria. A merged pull request is the approved output: here's the correct response, reviewed by a human. Thousands of these pairs, generated organically over years, sitting right there in the issue tracker and git log.
The same labeled pairs exist in every profession. An analyst's inbox is full of "MD asked for a model, here's the version that went to the client." A lawyer's email history contains "client asked a question, partner approved this answer." The training data is everywhere. It's just not anywhere a machine can reach it. Yet.
Context is what makes agents smart regardless of the model underneath. Give an agent complete context and a mediocre model will outperform a frontier model running blind. This is what the benchmarks miss. They test capability in a vacuum. Production tests capability with whatever context you can scrounge together.
In the enterprise, context is a disaster.
We spent the last fifteen years buying SaaS. Hundreds of tools, each best-in-class at one thing. Gong for calls. HubSpot for campaigns. Salesforce for pipeline. Zendesk for tickets. Amplitude for usage. Jira for feature requests. Stripe for payments. Google Analytics for acquisition. Notion for strategy docs.
Then there's the stuff that doesn't fit neatly into any tool. The Slack thread where your team debated whether to give a customer a discount. The email the CEO sent personally after a rough QBR. The offhand comment on a Zoom that changed the product roadmap. All of it is customer data. Almost none of it is reachable.
So what would it take to give an enterprise agent the same complete picture a codebase gives a coding agent?
Every piece of data in a business connects back to one of two things: a customer or an employee. That's it. Pipeline, revenue, support tickets, campaign performance, churn analysis: customer. Payroll, provisioning, compliance, headcount: employee. Every SaaS tool in the stack is a different view of data that ultimately joins on one of these two keys.
At a high level, a business does two things: get new customers and serve existing ones. There is no third thing. Finance exists to measure it. Product exists to enable it. Marketing exists to drive it. Strategy exists to direct it. Every function, every workflow, every decision traces back to the customer.
Now here's the problem. Everyone assumed Salesforce was the customer ontology. The system of record. The source of truth.
It isn't. 80% of customer data lives outside the CRM. Salesforce has deal stages and whatever a rep logs after a call. The actual customer relationship, what they said on the discovery call, what frustrated them in onboarding, which feature they begged for, why they almost churned, lives in Gong, Zendesk, Slack, email, product analytics. Salesforce is a scoreboard. It tells you the score. It can't tell you how the game was played or what to do next.
A scoreboard is not an ontology.
But the raw material for a real customer ontology already exists. The calls are recorded. The emails are logged. The support tickets are timestamped. The product usage is streaming. The data is in the cloud, scattered across dozens of systems, waiting to be unified.
Whoever gathers all of the data about acquiring and serving customers into a single, machine-readable graph builds the codebase equivalent for the rest of the business. That's the platform that automates white-collar work. Not because of a better model. Because of a better ontology.
Not the model layer. Not the agent layer. The meaning layer.
Some people call this a revenue ontology. We just call it the future of enterprise software.

How to transform Insurance Sales with AI-Powered Pipeline Intelligence
Insurance companies face unprecedented pressure from all sides. Customer expectations are rising, competition is intensifying, and the traditional methods of prospecting, selling, and retaining clients are showing their age. The old playbook of cold calling, manual CRM updates, and reactive customer service no longer delivers the growth insurers need.
The problem is clear: insurance sales teams are drowning in administrative tasks while missing their most valuable opportunities. When relationship managers spend up to 40% of their time on data entry and pipeline management rather than building client relationships, something needs to change.
Three Critical Challenges in Insurance Sales
1. The Champion Movement Problem
Insurance is fundamentally a relationship business. When key decision-makers—the champions who advocated for your policy or service—move to new companies, it represents both a significant risk and an enormous opportunity.
Industry data reveals that approximately 20% of insurance professionals change roles every year. This mobility matters tremendously because:
When champions leave current client companies, the renewal risk increases by 3x
When champions join new companies, they're 3x more likely to bring their trusted insurance providers with them
Yet most insurance companies have no systematic way to track these movements, resulting in millions in lost renewals and missed opportunities. Many insurers rely on insurance brokers remembering connections or manually checking LinkedIn profiles—a haphazard approach that inevitably leads to missed connections.
2. The Prospecting Efficiency Gap
Traditional insurance prospecting follows two inefficient paths:
Cold outreach: Sales representatives make largely untargeted calls or send generic emails to prospects who may not have any current interest in changing providers. This approach typically yields less than a 1% response rate and enormous wasted effort.
Inbound waiting game: Teams wait for potential clients to reach out—often far too late in the buying process, after they've already researched options and formed opinions. This passive approach surrenders competitive advantage and makes differentiation more difficult.
What's missing is the ability to identify high-intent prospects at the exact moment they're considering insurance options. Without this intelligence, even the most skilled sales teams struggle to focus their efforts efficiently.
3. The Data Disconnection Dilemma
Insurance companies have invested heavily in their tech stack—CRM systems, marketing automation platforms, customer success tools, and industry-specific software. However, these systems often exist in silos, creating fragmented data and an incomplete view of customer relationships.
This disconnection creates several critical problems:
Important customer information gets trapped in departmental silos
Sales teams lack visibility into marketing activities and vice versa
Renewal opportunities are missed due to incomplete account information
Cross-selling potential remains hidden beneath inaccessible data
Without a unified view of customer data, insurance companies struggle to deliver personalized experiences, protect renewals, and identify growth opportunities.
How AI Is Revolutionizing Insurance Sales Pipelines
Artificial intelligence is transforming how insurance companies manage their sales pipelines and customer relationships. Unlike traditional CRM systems that passively store data, AI-powered solutions actively monitor, analyze, and activate revenue opportunities.
Intelligence Beyond Data Storage
Modern AI solutions connect with the entire insurance tech ecosystem, from CRM to marketing automation and customer success platforms. This creates a single source of truth for all customer data, eliminating silos and ensuring no opportunity falls through the cracks.
As Harvey Rañola, Director of Digital Growth at a leading insurance provider, explains: "Within three months of implementing AI-powered pipeline intelligence, we're seeing pipeline that's 6-7x our investment, with potential for significantly more."
Automated Signal Detection
The most powerful AI platforms for insurance can automatically detect critical revenue signals, including:
Job changes: When key decision-makers move between companies
Digital intent: When prospects research insurance options on your website
Relationship networks: When existing clients connect with potential prospects
Competitive vulnerabilities: When competitors' clients show signs of dissatisfaction
These signals, once identified, can trigger automated workflows that ensure nothing falls through the cracks. For example, when a champion moves to a new company, the system can automatically update your CRM, alert the account manager, and suggest personalized outreach.
Intelligent Prospect Identification
Beyond reactive signal monitoring, advanced AI can proactively identify promising prospects based on ideal customer profiles. This capability transforms the prospecting process:
Automatically identifying key decision-makers at target accounts
Enriching contact data with accurate email addresses and phone numbers
Creating and updating contacts in your CRM
Triggering personalized outreach through your engagement platforms
For insurance teams targeting specific verticals or company sizes, this eliminates the manual prospecting burden, ensuring consistent pipeline generation with far less effort.
Building a Seamless Insurance Sales Pipeline with AI
For insurance companies, AI-powered workflows create a continuous cycle of opportunity detection and activation:
1. Unified Data Foundation
The foundation of an effective AI-powered sales pipeline is unified data. By connecting all your systems—CRM, marketing automation, customer success platforms, and industry-specific tools—AI creates a comprehensive view of your customer relationships.
This unified data foundation enables:
Complete visibility into customer interactions across all touchpoints
Accurate, real-time account information for all team members
Seamless collaboration between marketing, sales, and customer success
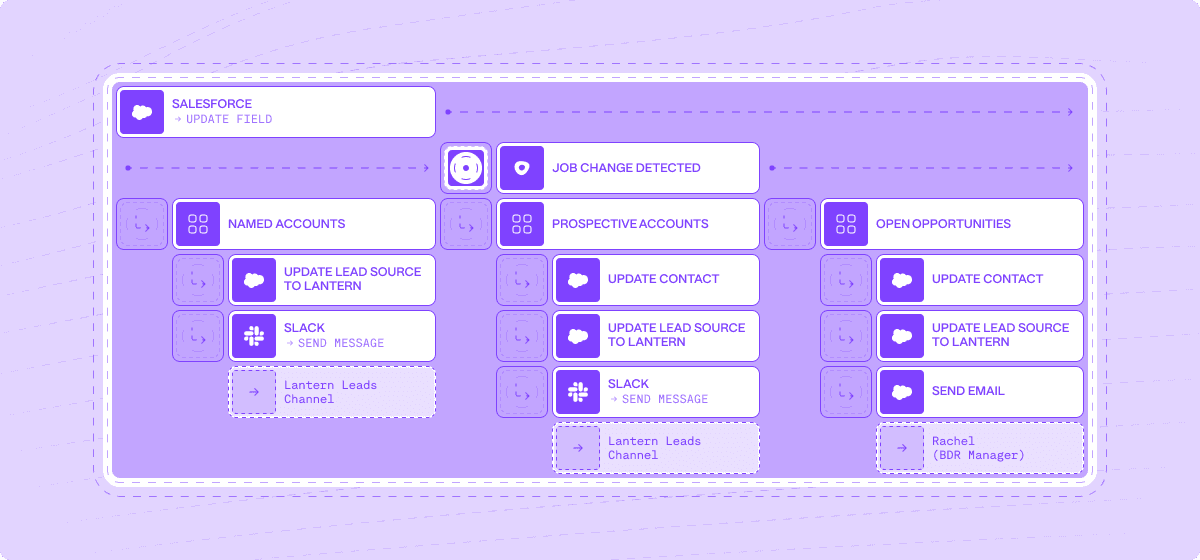
2. Intelligent Workflow Automation
With a solid data foundation in place, AI can automate critical workflows:
Job change detected → Update CRM → Alert account manager → Create personalized outreach sequence
Website intent signal → Score lead → Assign to appropriate team → Provide context and recommended next steps
Target account expansion → Identify missing stakeholders → Enrich contact data → Add to multi-threading campaign
These automated workflows ensure consistent execution, reducing manual tasks by up to 70% while improving response times and conversion rates.
3. AI-Enhanced Insights and Recommendations
Beyond automation, AI provides insurance teams with actionable intelligence:
Which accounts are most likely to convert based on engagement patterns
Which messaging and content resonates with specific personas
Which opportunities deserve immediate attention based on AI-powered scoring
This intelligence enables insurance sales teams to focus their efforts where they'll have the greatest impact, increasing productivity and results.
Real-World Impact: How Leading Insurers Are Using AI
Case Study: National Commercial Insurer
A national commercial insurance provider implemented AI-powered pipeline intelligence to track champion movements and identify opportunities within their existing customer base.
Challenge: The company was losing approximately 15% of renewals annually when key contacts changed jobs, with no systematic way to track these movements or capitalize on champions moving to new companies.
Solution: They implemented an AI-powered system that:
Monitored job changes across their entire customer base
Automatically updated their CRM with new contact information
Alerted account managers to both risks and opportunities
Suggested personalized outreach strategies
Results:
12 hours saved weekly on manual champion tracking and data management
$7.6M in new pipeline generated within the first 60 days
2.5x higher conversion rates on opportunities from AI-identified leads
15% reduction in churn by proactively identifying at-risk accounts
Case Study: Regional Health Insurance Provider
A regional health insurance provider used AI to improve their prospecting efficiency and focus on high-value opportunities.
Challenge: Their sales team was spending excessive time on low-probability prospects, resulting in inconsistent pipeline generation and missed growth targets.
Solution: They implemented an AI system that:
Identified high-intent prospects based on digital behavior
Enriched contact data automatically
Scored leads based on likelihood to convert
Triggered personalized outreach sequences
Results:
40% reduction in time spent on prospecting activities
3x increase in qualified opportunities
26.3% increase in win rates
9% increase in overall revenue
How Lantern's AI Agents Drive Insurance Sales Success
Lantern offers a specialized set of AI agents designed specifically for revenue intelligence and pipeline management. For insurance companies, Lantern's platform provides unique capabilities that address the industry's specific challenges.
Champion Agent
Lantern's Champion Agent automatically monitors job changes across your entire customer base, from current clients to open opportunities and even closed-lost accounts. When a key relationship changes companies, Lantern alerts you instantly.
Marina Ladonko, Enterprise Business Development leader, explains: "Champion Chaser not only saves us time—we're seeing results. We get alerted to job changes, connect with them on LinkedIn, and automatically add them to sequences with Workflow Builder. And best of all, we're getting higher response rates on our outreaches."
Intent Agent
Lantern's Intent Agent tracks digital buying signals across your web properties and third-party sources. This allows insurance teams to identify high-intent prospects at the exact moment they're considering options:
Decision-makers from target companies visiting your pricing pages
Current customers exploring new coverage options
Competitors' customers researching alternatives
When combined with automated workflow capabilities, these insights enable perfectly timed, highly relevant outreach.
Persona Tracker
Lantern's Persona Tracker automates the prospecting process for insurance teams targeting specific industries or company sizes. The system automatically identifies key decision-makers at target accounts based on your ideal customer profile, enriches their contact information, and sets up personalized outreach.
According to Shubh Sinha, Vice President at a leading insurance provider: "We were able to generate $7.6M in pipeline in the first 60 days—all thanks to Lantern. It's game-changing being able to leverage the Lantern CDP to integrate with all of our tools. It made Lantern a no-brainer."
The ROI of AI-Powered Pipeline Intelligence
Implementing AI-powered pipeline intelligence delivers measurable results for insurance companies:
Time Savings: Reduce administrative work by up to 70%, allowing teams to focus on relationship building
Pipeline Generation: Generate 3-5x more qualified opportunities through automated signal detection
Conversion Improvement: Achieve 2-3x higher conversion rates through better targeting and timing
Renewal Protection: Reduce churn by 15-20% by proactively identifying and addressing at-risk accounts
Insurance companies using advanced AI can expect an average ROI of 6-7x their investment within the first year, with increasing returns as the AI models continue to learn and improve.
The Insurance Sales Opportunity: Act Now
The insurance industry stands at a pivotal moment. Those who embrace AI-powered pipeline intelligence gain a significant competitive advantage, while those who stick with manual processes risk falling further behind.
Modern AI solutions like Lantern can be implemented quickly, with minimal IT resources required:
Connect your data sources: Integrate with your CRM, marketing tools, and customer success platforms
Configure your AI agents: Define your target personas, champion tracking parameters, and workflow rules
Activate your pipeline: Start receiving real-time alerts and recommendations
With dedicated support providing implementation assistance, training, and ongoing optimization, insurance companies can quickly transform their sales pipeline from a manual headache to an AI-powered competitive advantage.
The future of insurance sales belongs to companies that can detect and act on revenue signals faster than their competitors. With AI-powered pipeline intelligence, that future is here today.
Ready to transform your insurance sales pipeline?

Understanding Buying Signals: How to Track and Use Data
In today's hyper-competitive business landscape, the ability to identify and act on buying signals has become a critical differentiator between high-performing sales organizations and their competitors. Organizations that effectively utilize buying signals have reported a 10% to 20% increase in new opportunities, while simultaneously reducing their customer acquisition costs by up to 30%. This evolution in sales intelligence represents a fundamental shift in how successful organizations approach customer engagement and pipeline development.
The transformation from traditional sales approaches to signal-based selling isn't just about adopting new technology—it's about fundamentally changing how organizations understand and respond to customer behavior. In an era where buyers complete up to 80% of their journey before engaging with sales representatives, the ability to detect and interpret buying signals has become essential for survival and growth.
What Are Buying Signals?
Buying signals are indicators that suggest a potential customer's readiness to make a purchase decision. These signals manifest throughout the buyer's journey, ranging from subtle signs of initial interest to explicit declarations of purchase intent. Understanding these signals has become increasingly complex as buyer behavior evolves across multiple digital and traditional channels.
Modern buying signals extend far beyond traditional indicators like direct inquiries or budget discussions. They now encompass digital body language, engagement patterns, and organizational changes that might indicate buying potential. This evolution requires sales teams to develop more sophisticated approaches to signal detection and interpretation, combining technological capabilities with human insight.
The Strategic Impact of Buying Signals
The impact of effective buying signal tracking extends throughout the entire sales organization, transforming how teams identify, pursue, and close opportunities. When properly implemented, a buying signals strategy fundamentally changes the economics of sales operations. Organizations typically see reduced sales cycles, improved conversion rates, and more efficient resource allocation.
More importantly, effective signal tracking changes the nature of customer relationships. Instead of relying on interruptive outreach, sales teams can engage prospects at moments of genuine interest and need. This transformation leads to more meaningful conversations, better solution alignment, and ultimately, higher customer satisfaction and retention rates.
Types of Buying Signals and Their Significance
The landscape of buying signals is diverse and nuanced, requiring careful interpretation and strategic response. Explicit signals, such as demo requests or pricing inquiries, represent clear interest but must be understood within the broader context of the prospect's journey. When a potential customer takes such direct action, it often indicates they're in an active evaluation phase, making timing and response crucial.
Implicit signals require more sophisticated interpretation but often provide deeper insights into prospect needs and intentions. These might include patterns of content consumption, technical documentation reviews, or specific feature investigations. While less obvious than explicit signals, these behavioral indicators often reveal genuine interest and specific pain points that sales teams can address.
Organizational buying signals add another layer of complexity to signal interpretation. Changes in leadership, new strategic initiatives, or shifts in company direction can all indicate potential opportunities. However, these signals require careful validation and often benefit from correlation with other signal types to confirm their significance.
Signal Scoring and Prioritization
The art and science of signal scoring represents a crucial capability for modern sales organizations. Effective scoring systems combine multiple factors to assess signal strength and buying intent, enabling teams to prioritize their efforts for maximum impact. The most sophisticated systems incorporate both behavioral data and contextual information to generate meaningful insights.
Signal strength indicators must account for recency, frequency, and depth of engagement. A prospect who deeply engages with technical content over time typically shows stronger buying intent than one who briefly skims multiple resources. Similarly, engagement from multiple stakeholders within an organization often indicates more serious buying intent than isolated interactions from single individuals.
Modern scoring systems also need to consider the prospect's fit with ideal customer profiles and their level of authority in the buying process. This holistic approach ensures that high scores represent not just interest, but genuine opportunity aligned with organizational capabilities and goals.
The Role of Time in Signal Interpretation
Time is perhaps the most critical yet overlooked dimension in signal interpretation. The value and relevance of buying signals decay at different rates, requiring sales organizations to develop sophisticated response frameworks that account for these varying lifespans. Understanding these temporal patterns can mean the difference between capitalizing on a prime opportunity and missing it entirely.
Immediate response signals, such as demo requests or pricing inquiries, represent the most time-sensitive category. These signals indicate active buying interest and require rapid response protocols. When a potential customer takes the time to request a demo or specific pricing information, they're typically evaluating multiple solutions simultaneously. Research shows that organizations responding within the first hour of receiving such signals are seven times more likely to qualify the lead than those waiting even sixty minutes longer.
Short-term signals, while less urgent, still require structured follow-up protocols. These signals often manifest through content engagement, website visits, or event registrations. The key to effectively managing short-term signals lies in understanding their context within the broader buyer journey. For instance, a prospect downloading a technical whitepaper might not need immediate sales contact, but their interest should be nurtured through relevant content and touchpoints over the following days or weeks.
Long-term signals require the most nuanced approach. These typically emerge through industry research, technology evaluations, or strategic initiatives that might take months to develop into concrete opportunities. Success with long-term signals depends on maintaining consistent, value-added engagement without appearing overly aggressive. This might involve quarterly check-ins, sharing relevant industry insights, or providing updates about product developments that align with the prospect's known interests.
Cultural and International Considerations
The interpretation and handling of buying signals vary dramatically across different cultures and regions, making it essential for global organizations to develop nuanced approaches to signal interpretation. What might be considered a strong buying signal in one culture could be meaningless or even counterproductive in another, requiring sales teams to develop cultural intelligence alongside their technical expertise.
In Western markets, particularly in North America, buying signals often manifest through direct communication and explicit interest. Prospects typically follow a more linear buying process, with clear stages and direct feedback. Decision-makers are more likely to engage in straightforward discussions about needs, budgets, and timelines. This directness extends to digital behavior, where actions like downloading pricing information or requesting demos are reliable indicators of buying intent.
Asian markets present a markedly different landscape, where relationship building and indirect communication dominate the buying process. Signals in these markets often emerge through subtle cues and relationship dynamics rather than explicit statements of interest. The emphasis on consensus and harmony means that negative signals might be particularly difficult to detect, as prospects may avoid direct confrontation or rejection. Success in these markets requires sales teams to pay attention to contextual clues and invest time in understanding the broader organizational dynamics at play.
European markets occupy a middle ground, combining elements of both direct communication and formal process adherence. The emphasis on compliance and regulation means that buying signals often emerge through technical and legal due diligence processes rather than traditional sales interactions. Understanding these regional variations is crucial for global organizations looking to accurately interpret and act on buying signals across different markets.
Building the Right Team
The foundation of effective buying signal tracking lies in assembling and organizing the right team. This goes beyond simply hiring analysts or sales professionals; it requires building a cross-functional unit that combines analytical capabilities with deep market understanding and technical expertise.
Signal analysts form the backbone of the team, bringing advanced analytical capabilities and pattern recognition skills. These professionals need to combine statistical knowledge with business acumen, enabling them to distinguish meaningful signals from market noise. They work closely with response coordinators, who manage the tactical execution of signal-based initiatives and ensure that insights translate into action.
Technology specialists play a crucial role in maintaining and optimizing the technical infrastructure that enables signal tracking. Their responsibilities include system integration management, data quality assurance, platform optimization, and technical troubleshooting. The effectiveness of the entire signal tracking operation depends on the reliability and efficiency of these technical foundations.
Sales enablement professionals serve as the bridge between analysis and action, transforming raw signal data into actionable sales intelligence. They develop playbooks, training materials, and response protocols that help sales teams maximize the value of identified signals.
Measuring Success and ROI
The effectiveness of buying signal tracking must be measured through both quantitative metrics and qualitative assessments to provide a complete picture of its impact on the organization. This multifaceted approach to measurement ensures that both immediate results and long-term value creation are properly captured and evaluated.
At its core, successful signal tracking should lead to measurable improvements in sales efficiency and effectiveness. Organizations typically see reductions in sales cycle length ranging from 20% to 40% when properly implementing signal tracking systems. These improvements stem from better prospect prioritization and more timely engagement, allowing sales teams to focus their efforts on opportunities with the highest likelihood of conversion.
Revenue impact represents another crucial dimension of signal tracking success. Companies with mature signal tracking capabilities often report increases in average deal size and improved win rates. This occurs because sales teams can engage prospects at more opportune moments and with more relevant offerings, leading to better alignment between solution and need.
The long-term strategic value of signal tracking extends beyond immediate sales metrics. Organizations develop deeper market intelligence, stronger customer relationships, and more precise competitive positioning through systematic signal tracking and analysis. These benefits, while harder to quantify, often prove more valuable than the direct revenue impact over time.
Future Trends in Buying Signals
The landscape of buying signal tracking continues to evolve rapidly, driven by advances in technology and changes in buyer behavior. Artificial intelligence and machine learning are transforming how organizations detect and interpret signals, enabling more sophisticated pattern recognition and predictive capabilities. These technologies are particularly valuable in identifying subtle signals that human analysts might miss and in scaling signal tracking across large volumes of data.
The rise of digital-first buying behaviors is also reshaping signal tracking. As more of the buying process moves online, new types of signals emerge while traditional indicators may become less relevant. Organizations must adapt their signal tracking capabilities to capture and interpret these emerging digital behaviors effectively.
Conclusion
The mastery of buying signals represents a fundamental shift in how organizations approach sales and customer engagement. Success requires a balanced approach combining technology, process, and human insight. Organizations that excel in signal tracking will find themselves better positioned to identify opportunities earlier, engage prospects more effectively, and build stronger customer relationships.
The future of sales lies in the ability to not just collect signal data, but to transform it into meaningful insights and actions that drive business growth. Organizations that invest in developing these capabilities now will be best positioned to thrive in an increasingly competitive marketplace.
By maintaining a comprehensive approach to buying signals—one that considers technical, organizational, and human factors—companies can build robust systems that drive measurable improvements in sales performance and customer satisfaction. The key lies not in any single technology or process, but in developing an integrated approach that aligns with organizational goals and customer needs.

The Future of AI SDRs: How Lantern's Agentic Approach Solves Pipeline Challenges
AI-powered Sales Development Representatives (SDRs) have seen high churn rates of 50-70%, leading many to call them "the biggest bubble in tech." Yet the core use case remains valid. This article explains why early AI SDR solutions failed and how Lantern's agentic approach is transforming pipeline generation with intelligent automation that works alongside human teams.

What are AI SDRs and why are they important?
AI SDRs are artificial intelligence tools designed to automate sales development tasks including prospecting, personalization, and engagement. Unlike human SDRs, AI SDRs can work 24/7, process vast amounts of data, and scale without additional headcount costs. According to recent data, 65% of organizations now report regularly using generative AI, nearly double from 10 months prior in 2024.
The potential benefits include:
Continuous pipeline generation without human limitations
Consistent outreach across all prospects
Data-driven personalization at scale
Reduced cost per qualified meeting
Ability to experiment with go-to-market strategies rapidly
Why are traditional AI SDRs failing? 3 critical problems
Despite hundreds of millions in venture funding, the first wave of AI SDR tools has fallen short of expectations. Here are the three main reasons:
1. Low-quality data inputs produce low-quality outputs
Traditional AI SDRs rely on generic datasets from sources like LinkedIn and basic CRM data. As MIT researchers confirmed in their 2024 study on LLM performance, "input quality directly correlates with output effectiveness." Without differentiated data sources, these tools simply become automated spam machines.
Key statistic: 75% of C-suite executives who prioritized AI investments reported disappointment with the ROI they've seen.
2. RevOps integration is an afterthought
Sales Operations teams must manage the following challenges with most AI SDR platforms:
Manual data uploads
Complex prompt engineering requirements
Hidden decision-making processes behind algorithms
Difficulty integrating with existing CRM and sales tech stacks
This creates more work for Operations teams rather than streamlining their workflows.
3. Hybrid human-AI workflows create friction
Most organizations don't want fully autonomous AI SDRs handling their entire sales process. When human and AI collaboration is poorly designed, it results in:
Reps needing to manually review and fix low-quality AI outputs
Toggle fatigue from switching between multiple systems
Duplicated work and CRM hygiene issues
Inconsistent customer experiences

The Lantern approach: Agentic pipeline generation
Lantern has developed a new framework for AI-powered sales development that solves these fundamental problems. Our agentic approach focuses on three key areas:
1. Intelligent signal capture and enrichment
Show Image
Lantern's AI agents actively hunt for buying signals across:
Job changes among target buyers
Website visits and engagement
Dark funnel activities (communities, forums, social)
Product usage patterns
News and company developments
What makes Lantern different: Our system automatically integrates first-party, second-party and third-party data sources, creating a comprehensive view of each prospect that generic AI tools cannot match.
"We've seen 67% higher engagement rates when our outreach is based on Lantern's multi-signal approach versus traditional methods," says Jordan Martinez, Head of Sales at TechVantage Solutions.
2. Seamless RevOps orchestration
Show Image
Lantern's AI orchestration capabilities include:
No-code signal prioritization rules
Automatic lead scoring based on multiple factors
Dynamic segmentation that updates in real-time
Integration with your existing CRM and sales tools
Transparent AI decision-making with full audit trails
Key statistic: Organizations using Lantern's orchestration capabilities report 43% less time spent on manual data management and 28% more time on high-value selling activities.
3. Human-AI collaborative workflows
Show Image
Lantern's approach to human-AI collaboration ensures:
AI handles data gathering, enrichment, and initial outreach preparation
Human reps maintain control over final messaging and relationship building
Natural handoffs between automated and manual processes
Continuous improvement through feedback loops
"Lantern doesn't replace our SDRs—it makes them superhuman," explains Sarah Johnson, CRO at DataFlow Systems. "Our reps now handle 3x more qualified conversations per day while delivering more personalized experiences."
Real-world results: The Lantern difference
Organizations implementing Lantern's agentic approach have seen transformative results:
74% increase in pipeline generation in a single quarter (Semgrep case study)
3.2x improvement in meeting conversion rates from cold outreach
41% reduction in cost per qualified opportunity
89% adoption rate among sales teams compared to industry average of 43%
Unlike standalone AI SDR tools, Lantern integrates seamlessly with your existing workflows:
Works within your CRM ecosystem
Augments rather than replaces human expertise
Adapts to your specific go-to-market motion
Provides transparency into AI decisions

Getting started with Lantern's agentic approach
Implementing an effective AI-powered sales development program requires the right foundation. Here are three steps to get started:
1. Audit your current signals and data sources
Identify gaps in your prospect intelligence
Evaluate quality of existing data
Map your customer journey touchpoints
2. Define your human-AI collaboration model
Determine which tasks should be automated vs. human-led
Establish clear handoff processes
Create feedback mechanisms for continuous improvement
3. Measure impact beyond activity metrics
Track pipeline influence, not just activity counts
Measure time savings for sales teams
Calculate ROI based on total pipeline impact
Conclusion: The AI SDR is evolving, not dying
The initial wave of standalone AI SDRs may have disappointed, but the core promise remains valid. With Lantern's agentic approach, organizations can now harness the power of AI for sales development without the drawbacks of first-generation tools.
The future belongs to solutions that seamlessly blend AI capabilities with human expertise, creating a system greater than the sum of its parts. By focusing on signal quality, operational integration, and collaborative workflows, Lantern is defining the next evolution of AI-powered pipeline generation.
Ready to transform your pipeline generation with Lantern's agentic approach? Book a demo or start a free trial today.
FAQ: AI SDRs and Agentic Pipeline Generation
What's the difference between traditional AI SDRs and Lantern's agentic approach?
Traditional AI SDRs focus on automating outreach with generic data. Lantern's agentic approach continuously gathers signals, enriches data, and orchestrates personalized actions based on prospect behavior and needs.
How long does it take to implement Lantern's solution?
Most organizations see value within the first 2 weeks. Full implementation typically takes 4-6 weeks depending on your tech stack complexity.
Does Lantern replace my existing sales development tools?
No. Lantern integrates with your existing CRM, sales engagement platforms, and data sources to enhance their effectiveness rather than replace them.
How does Lantern measure ROI?
Lantern tracks multiple metrics including pipeline generated, meeting conversion rates, time saved by sales teams, and cost per qualified opportunity to provide a comprehensive view of ROI.
Is Lantern suitable for both enterprise and startup sales motions?
Yes. Lantern's flexible approach adapts to different sales motions, from high-volume startup outreach to complex enterprise account-based strategies.

Why B2B Teams Need a GTM Intelligence Layer
The modern B2B tech stack is breaking. As CAC continues to skyrocket (up 60% in the last six years according to Boston Consulting Group) and buying committees grow more complex, revenue teams find themselves drowning in disconnected tools that create more problems than they solve. The promise of digital transformation has led to digital chaos, with the average enterprise now using over 440 different SaaS applications across their GTM functions.
But here's the truth nobody's talking about: adding more point solutions isn't the answer. The future of revenue generation lies not in more tools, but in connecting and activating the data you already have through an intelligent layer that spans your entire GTM operation.

The Hidden Cost of Point Solution Proliferation
The symptoms are familiar to any revenue leader:
Sales reps jumping between 6-7 different tools just to research a single prospect
Marketing campaigns running in silos, disconnected from sales intelligence
Customer success working with outdated or incomplete account information
Critical buying signals lost in the noise of disconnected systems
But the real cost goes beyond mere inefficiency. According to recent studies, companies lose up to 30% of their revenue potential to poor tool integration and data silos. In today's market, where every customer interaction counts, this is a price too high to pay.
Why Traditional Integration Isn't Enough
Many organizations have attempted to solve this problem through point-to-point integrations or data warehouses.
While these approaches can help move data between systems, they fall short in three critical ways:
They're Static: Traditional integrations move data but don't make it actionable. Having customer data in your CRM isn't valuable if your teams can't easily understand and act on it.
They're Rigid: Most integration solutions are built for specific use cases and struggle to adapt as your GTM motion evolves.
They Lack Intelligence: Moving data between systems is only the first step. Without an intelligence layer to analyze and activate that data, you're still leaving value on the table.

The Intelligence Layer: A New Paradigm for GTM Operations
An intelligence layer is more than just another tool in your tech stack—it's a fundamental shift in how revenue teams operate. Think of it as the brain of your GTM operation, connecting disparate systems while adding the crucial element of intelligence that turns data into action.Key Components of an Effective Intelligence Layer
Unified Data Foundation
Real-time data synchronization across all GTM tools
Automatic data cleansing and enrichment
Single source of truth for customer information
Intelligent Signal Detection
Automated monitoring of buyer intent signals
Real-time tracking of account changes and opportunities
Proactive identification of risks and opportunities
Automated Workflow Orchestration
Intelligent routing of opportunities to the right teams
Automated follow-up sequences based on buyer behavior
Cross-functional workflow automation
Predictive Analytics and Insights
AI-powered opportunity scoring
Predictive account health monitoring
Revenue forecasting and trend analysis
The Business Impact of an Intelligence Layer
Organizations that successfully implement an intelligence layer see transformative results:
1. Improved Revenue Efficiency
40-60% reduction in time spent on manual data entry
25-35% increase in sales productivity
15-20% improvement in campaign conversion rates
2. Enhanced Customer Experience
Consistent messaging across all channels
Faster response times to customer needs
More personalized interactions at scale
3. Better Decision Making
Real-time visibility into pipeline health
More accurate revenue forecasting
Data-driven resource allocation

Common Pitfalls to Avoid
As organizations move to implement an intelligence layer, there are several common mistakes to watch out for:
Starting Too BigInstead of trying to transform everything at once, focus on specific high-impact use cases and expand from there.
Ignoring Change ManagementThe best technology won't matter if your teams don't adopt it. Invest in proper training and change management.
Neglecting Data QualityAn intelligence layer is only as good as the data it works with. Ensure you have a solid data governance strategy in place.
Building Your Intelligence Layer Strategy
Step 1: Assess Your Current State
Map your existing tech stack
Identify key data silos and integration gaps
Document manual processes that could be automated
Step 2: Define Your Objectives
Set clear goals for what you want to achieve
Prioritize use cases based on business impact
Establish KPIs to measure success
Step 3: Choose the Right PlatformLook for solutions that offer:
Comprehensive data integration capabilities
AI-powered automation and insights
Flexible workflow configuration
Enterprise-grade security and compliance
Proven scalability
The Lantern Approach: Intelligence Layer Done Right
While many vendors claim to offer intelligence layer capabilities, Lantern stands apart through its comprehensive approach to revenue intelligence. Built from the ground up to serve as a true intelligence layer, Lantern combines:
Complete Signal Coverage: Real-time monitoring across 50+ tools and data sources
AI-Powered Workflows: Intelligent automation that goes beyond simple rules
Enterprise-Grade Intelligence: Fully customizable workflows with granular controls
But what truly sets Lantern apart is its ability to deliver immediate value while scaling with your organization. Unlike point solutions that solve single problems, Lantern's intelligence layer grows more valuable as you use it, continuously learning and adapting to your unique GTM motion.
Looking Ahead: The Future of GTM Technology
The future of GTM technology isn't about adding more tools—it's about making your existing stack work smarter. As we move into an era of AI-driven revenue operations, the organizations that thrive will be those that successfully implement an intelligence layer to unite their GTM stack.
Key Trends to Watch:
Increased focus on workflow automation and orchestration
Growing importance of predictive analytics in GTM decisions
Rise of AI-powered personalization at scale
Shift toward unified customer data platforms
Taking the Next Step
As you evaluate your GTM tech stack and consider implementing an intelligence layer, ask yourself these key questions:
How much time do your teams spend switching between tools?
How many opportunities are you missing due to disconnected systems?
What would be possible if your entire GTM stack worked as one?
The answers to these questions will help guide your journey toward a more intelligent, unified GTM operation.
Conclusion
The era of point solutions is ending. In today's complex B2B landscape, success requires more than just a collection of tools—it requires an intelligent layer that can unite, analyze, and activate your entire GTM stack. Organizations that recognize and act on this shift will find themselves well-positioned for success in the evolving B2B landscape.Whether you're just starting to explore the concept of an intelligence layer or ready to take the next step in your GTM evolution, the time to act is now. The cost of maintaining the status quo—in terms of lost opportunities, inefficient operations, and growing GTM bloat—is simply too high to ignore.

What is the Use of Signal-Based Selling in Modern Sales Strategy?
Signal-based selling is revolutionizing the way sales teams approach prospects in today's competitive market. Gone are the days of waiting for leads to come to you. Instead, modern sales strategies focus on identifying and engaging with potential customers at the right time. It’s like catching a wave right when it’s about to break—timing is everything.
In today’s landscape, navigating the process of bringing products to market and delivering quality results has become increasingly complex. Market saturation and the overuse of broad outbound strategies make it harder to stand out.
What’s more? Internal barriers and risk aversion further slow down deals. With more stakeholders involved, sales cycles are longer, and fewer deals are being closed.
Well, signal-based selling helps overcome these challenges. By tracking behavioral signals, such as when prospects engage with your website or interact with your content, sales teams can identify when someone is actively looking for solutions.
In this article, we’ll explore how signal-based selling works and why it’s becoming essential in modern sales. So, let’s begin with understanding what signal-based selling is.
What is Signal-Based Selling?
Signal-based selling is a modern sales strategy that involves recognizing and responding to various buying signals from potential customers. Unlike traditional sales methods, which often rely on a one-size-fits-all approach, this strategy uses specific cues from customer interactions to modify the sales pitch. This could mean anything from noting a customer's interest in a product feature to tracking their engagement levels on a website or across social media.
Why does this matter? By understanding a customer's specific needs and behaviors, you can make your sales efforts more effective and targeted. This increases the likelihood of a sale and improves customer satisfaction because you're addressing their specific interests and concerns.
In fact, research has shown that 79% of sales professionals believe that personalized content relevant to the business of a prospect increases the likelihood of establishing a connection.
Implementing signal-based selling involves key steps:
Gathering data from various touchpoints to gain a complete understanding of potential customers' behavior.
Analyzing the data to identify high-value signals that suggest purchase intent.
Developing personalized interaction strategies that align with the specific interests and needs of each prospect.
Continuously refining strategies based on feedback and changing market trends.
With that in mind, let’s dive deeper into why signal-based selling is important.
Why is Signal-Based Selling Important in Modern Sales Strategy?
Signal-based selling isn't just about boosting sales efficiency. It's about adapting to today's consumers' evolving behaviors and expectations Here’s a deeper look at why it’s indispensable:
1. Real-time responsiveness
By receiving alerts when a potential customer visits your pricing page or downloads a white paper, you can engage them at the peak of their interest. Try reaching out in the first 5 minutes as 44% of online customers expect that, highlighting the importance of timely interactions.
2. Personalized interactions
Understanding each prospect's specific actions and behavior allows for highly customized communication. Whether it’s tailoring email marketing messages based on the content they’ve interacted with or suggesting products aligned with their browsing patterns, personalization increases the relevance and impact of your outreach.
3. Increased efficiency
Signal-based selling automates the laborious task of tracking and analyzing customer actions across various channels. This speeds up the sales process and reduces human error, ensuring that no critical data slips through the cracks.
4. Enhanced customer experience
Today's Customers expect interactions that are responsive and contextually relevant. Signal-based selling enables you to offer solutions that are timely and pertinent, significantly enhancing customer satisfaction and loyalty.
5. Data-driven decision making
With a wealth of data at your fingertips, you can make informed decisions about where to allocate resources, which strategies are working, and which areas need improvement. This strategic advantage is crucial, especially when 64% of marketing leaders believe data-driven marketing is vital for success in a competitive economy.
When you drill down into these aspects, it becomes clear that signal-based selling isn’t just another tool—it’s a transformative approach that adapts to and meets the evolving demands of both sales teams and customers.
Signal based selling involves various kinds of signals at different stages. Let’s look at them with the help of the table below.
Key Signals to Watch for in Signal-Based Selling
There are various signals available, but you need to identify the right ones at the right time to make your strategy work. Here’s a breakdown of what you need to know:
Champion Movement Signals
Customer Job Changes: Monitoring job changes among customers helps identify when key decision-makers move, potentially opening up new sales opportunities in their new organizations.
Former Customers Moving to New Companies: The transition of previous customers to new companies presents an opportunity to reintroduce your solutions, leveraging past goodwill and familiarity.
Role Changes in Lost Opportunity Contacts: Role changes in contacts from previously lost opportunities provide a chance to re-engage under new circumstances.
New Roles for Decision-Makers at Target Accounts: Tracking when decision-makers assume new roles at target accounts can signal an opportune time to pitch your products as these individuals may bring fresh perspectives.
Company Growth Signals
New Executive Hires: New leadership in target accounts can bring strategic changes, potentially aligning more closely with your solutions.
Financial Events: Such events often lead to increased budgets and a willingness to invest in new technologies.
Office Expansions or New Offices: Expansion necessitates new technology and solutions to support growth.
Technology Stack Changes: Changes in a company's tech stack can create opportunities for your solutions to integrate or replace legacy systems.
Hiring Patterns in Relevant Departments: An increase in hiring indicates growth and new needs that your products might fulfill.
Buying Committee Signals
Formation of New Buying Committees: Indicates an organized effort to evaluate and possibly acquire new solutions.
More Stakeholders in Evaluation: More stakeholders becoming involved can indicate a more comprehensive evaluation process.
Missing Stakeholder Identification: Identifying absent stakeholders necessary for a decision allows for targeted outreach.
Multi-threading Opportunities: Engaging multiple stakeholders across different levels or functions within the company can strengthen your position.
Behavioral Signals
Website Activity: Indicates interest through actions such as frequent page visits, long stays, and downloads.
Email Engagement: High engagement levels through email opens, clicks, and responses suggest serious consideration of your offerings.
Content Interaction: Monitoring interactions with content like whitepapers and webinars can indicate a move closer to a purchase decision.
Buying Intent Signals
Web and Product Interactions: Frequent visits to product and pricing pages are strong indicators of buying intent.
Demo Requests and Pricing Inquiries: Actions such as requesting demos or asking about pricing typically occur at the final stages of the buying process.
Barrier Signals
Objections or Concerns: Expressing doubts about a product or service suggests barriers that need addressing.
Stuck Communication: A sudden stop in communication may indicate a loss of interest or internal issues.
Event-Triggered Signals
Company Expansion and Product Launches: These events present opportunities for proposing new products or services.
Financial Events and Webinar/Event Participation: Significant financial changes or attendance at specific events can indicate readiness to invest in solutions or engage further with related offerings.
What is The Future of Signal-Based Selling?
Signal-based selling is now an essential strategy for modern sales teams, allowing them to use real-time data to refine their sales approach. As technology rapidly evolves, so does the ability of companies to quickly and correctly understand a lot of data about what customers want. AI is already reshaping this industry by improving how companies manage and interpret vast data streams to pinpoint customer demands.
In the future, AI and machine learning will play even bigger roles. These technologies will help sales teams not just react to current customer actions but also predict future customer desires. The use of AI to predict customer behavior will become more common, making it easier for companies to engage with customers and close sales more effectively. This shift will empower companies to make faster, smarter, data-driven decisions, ensuring they remain competitive in responding to evolving market demands.
Execution Gap
Every CMO knows what campaign they want to run. The strategy is ready on day one.
What kills it is everything between the brief and the launch. A brief goes to the agency, the agency comes back with creative, the creative goes back for revisions, and then it's media buying and legal review and another round of notes and a reshoot and finally – six weeks after someone had the idea – the ads go live. The moment's gone. The market moved. The insight that sparked the campaign is stale.
This is the execution gap. And every marketing org in the world is trapped in it.
It's not a people problem. The people are great. It's an output problem that everyone has been solving by hiring more people. The 500-person marketing org wasn't built because marketing is intrinsically a 500-person job. It was built because execution used to be time consuming.
Launching a campaign shouldn't be this hard. We know because we've watched it get easy somewhere else.
Agents work for engineering. Engineers hand off tickets and come back to working code that actually merges. Nothing else does. Every other agent product is a demo that falls apart the second you try to use it in production. Same underlying models, same capabilities, totally different outcome. The gap isn't the model: it's the context.
A codebase is a complete world an agent can reason over. Types, tests, imports, git history. Without meaning to, programmers built the first real ontology: a machine-readable map of every entity, every relationship, every rule that governs how the system works. Hand an agent a codebase and every fact it needs is already there.
Hand an agent a marketing team and it's working blind.
The customer insights are in Gong. The campaigns are in HubSpot. The pipeline is in Salesforce, which everyone treats as the source of truth even though 80% of the actual customer relationship lives somewhere else entirely – in a Slack thread from three months ago, in an email nobody remembers, in a product analytics tool three people on the team have access to. That's why every "AI for marketing" product you've seen is a demo. The models are fine. The context is broken.
We fixed the context.
Lantern is the first revenue ontology platform. We unify every piece of customer data across every system your company runs – first party, third party, structured, unstructured – into a single machine-readable graph. Then we put agents on top of it. Not one agent pretending to be a marketer, but a library of them, each built for a specific piece of the work.
I wrote the long-form argument for why ontology is the whole ballgame last week. If you want the technical foundation, it's here. This post is about what happens once you have it.
Give Lantern a brief and it comes back with the campaign. In 10 minutes or less. Ads, landing pages, email sequences, social, competitive teardowns, the whole thing. Not a draft – a shipped campaign, on-brand and in most cases better than what your current team would produce because it can reach context your current team can't.
We're working with a Fortune 500 company whose marketing department has more than 3,000 people. During the pilot, leadership asked us not to present the work to the marketing team. Not because the work was bad. Because it was too good – and they hadn't decided what kind of organization they wanted to be on the other side.
That's the decision every B2B marketing org is about to face. Not whether this technology works. It works. The decision is what you do with it.
Path one: use it to cut. Shrink the team, pocket the savings, keep running the same campaigns with fewer people. The budget that used to pay for execution now goes into channels. Some companies will do this; Dorsey laid off 50% of Square employees last month.
Path two: use it to attack. Keep your best people – the strategists, the creatives, the operators who actually understand your market – and unleash them. Launch 10x more campaigns. Personalize every one of them. Run the wild ideas that used to die in prioritization because they were too expensive, too ambitious, too operationally complex. The hours that used to go into building campaigns now go into imagining better ones.
We are about to enter the golden age of marketing. More creative. More ambitious. More personal. "It costs too much, it's too ambitious, it takes too much time" – those are complaints of the past.
To every CMO in the global 2000: you need to decide which path you're on. The companies that move first get to choose how this lands. The companies that wait get the decision made for them.
You don't have to believe me.
Text +1 (650) 222-1296 and chat with a Lantern agent.
The Future of AI SDRs: How Lantern's Agentic Approach Solves Pipeline Challenges
AI-powered Sales Development Representatives (SDRs) have seen high churn rates of 50-70%, leading many to call them "the biggest bubble in tech." Yet the core use case remains valid. This article explains why early AI SDR solutions failed and how Lantern's agentic approach is transforming pipeline generation with intelligent automation that works alongside human teams.
What are AI SDRs and why are they important?
AI SDRs are artificial intelligence tools designed to automate sales development tasks including prospecting, personalization, and engagement. Unlike human SDRs, AI SDRs can work 24/7, process vast amounts of data, and scale without additional headcount costs. According to recent data, 65% of organizations now report regularly using generative AI, nearly double from 10 months prior in 2024.
The potential benefits include:
Continuous pipeline generation without human limitations
Consistent outreach across all prospects
Data-driven personalization at scale
Reduced cost per qualified meeting
Ability to experiment with go-to-market strategies rapidly
Why are traditional AI SDRs failing? 3 critical problems
Despite hundreds of millions in venture funding, the first wave of AI SDR tools has fallen short of expectations. Here are the three main reasons:
1. Low-quality data inputs produce low-quality outputs
Traditional AI SDRs rely on generic datasets from sources like LinkedIn and basic CRM data. As MIT researchers confirmed in their 2024 study on LLM performance, "input quality directly correlates with output effectiveness." Without differentiated data sources, these tools simply become automated spam machines.
Key statistic: 75% of C-suite executives who prioritized AI investments reported disappointment with the ROI they've seen.
2. RevOps integration is an afterthought
Sales Operations teams must manage the following challenges with most AI SDR platforms:
Manual data uploads
Complex prompt engineering requirements
Hidden decision-making processes behind algorithms
Difficulty integrating with existing CRM and sales tech stacks
This creates more work for Operations teams rather than streamlining their workflows.
3. Hybrid human-AI workflows create friction
Most organizations don't want fully autonomous AI SDRs handling their entire sales process. When human and AI collaboration is poorly designed, it results in:
Reps needing to manually review and fix low-quality AI outputs
Toggle fatigue from switching between multiple systems
Duplicated work and CRM hygiene issues
Inconsistent customer experiences
The Lantern approach: Agentic pipeline generation
Lantern has developed a new framework for AI-powered sales development that solves these fundamental problems. Our agentic approach focuses on three key areas:
1. Intelligent signal capture and enrichment
Show Image
Lantern's AI agents actively hunt for buying signals across:
Job changes among target buyers
Website visits and engagement
Dark funnel activities (communities, forums, social)
Product usage patterns
News and company developments
What makes Lantern different: Our system automatically integrates first-party, second-party and third-party data sources, creating a comprehensive view of each prospect that generic AI tools cannot match.
"We've seen 67% higher engagement rates when our outreach is based on Lantern's multi-signal approach versus traditional methods," says Jordan Martinez, Head of Sales at TechVantage Solutions.
2. Seamless RevOps orchestration
Show Image
Lantern's AI orchestration capabilities include:
No-code signal prioritization rules
Automatic lead scoring based on multiple factors
Dynamic segmentation that updates in real-time
Integration with your existing CRM and sales tools
Transparent AI decision-making with full audit trails
Key statistic: Organizations using Lantern's orchestration capabilities report 43% less time spent on manual data management and 28% more time on high-value selling activities.
3. Human-AI collaborative workflows
Show Image
Lantern's approach to human-AI collaboration ensures:
AI handles data gathering, enrichment, and initial outreach preparation
Human reps maintain control over final messaging and relationship building
Natural handoffs between automated and manual processes
Continuous improvement through feedback loops
"Lantern doesn't replace our SDRs—it makes them superhuman," explains Sarah Johnson, CRO at DataFlow Systems. "Our reps now handle 3x more qualified conversations per day while delivering more personalized experiences."
Real-world results: The Lantern difference
Organizations implementing Lantern's agentic approach have seen transformative results:
74% increase in pipeline generation in a single quarter (Semgrep case study)
3.2x improvement in meeting conversion rates from cold outreach
41% reduction in cost per qualified opportunity
89% adoption rate among sales teams compared to industry average of 43%
Unlike standalone AI SDR tools, Lantern integrates seamlessly with your existing workflows:
Works within your CRM ecosystem
Augments rather than replaces human expertise
Adapts to your specific go-to-market motion
Provides transparency into AI decisions
Getting started with Lantern's agentic approach
Implementing an effective AI-powered sales development program requires the right foundation. Here are three steps to get started:
1. Audit your current signals and data sources
Identify gaps in your prospect intelligence
Evaluate quality of existing data
Map your customer journey touchpoints
2. Define your human-AI collaboration model
Determine which tasks should be automated vs. human-led
Establish clear handoff processes
Create feedback mechanisms for continuous improvement
3. Measure impact beyond activity metrics
Track pipeline influence, not just activity counts
Measure time savings for sales teams
Calculate ROI based on total pipeline impact
Conclusion: The AI SDR is evolving, not dying
The initial wave of standalone AI SDRs may have disappointed, but the core promise remains valid. With Lantern's agentic approach, organizations can now harness the power of AI for sales development without the drawbacks of first-generation tools.
The future belongs to solutions that seamlessly blend AI capabilities with human expertise, creating a system greater than the sum of its parts. By focusing on signal quality, operational integration, and collaborative workflows, Lantern is defining the next evolution of AI-powered pipeline generation.
Ready to transform your pipeline generation with Lantern's agentic approach? Book a demo or start a free trial today.
FAQ: AI SDRs and Agentic Pipeline Generation
What's the difference between traditional AI SDRs and Lantern's agentic approach?
Traditional AI SDRs focus on automating outreach with generic data. Lantern's agentic approach continuously gathers signals, enriches data, and orchestrates personalized actions based on prospect behavior and needs.
How long does it take to implement Lantern's solution?
Most organizations see value within the first 2 weeks. Full implementation typically takes 4-6 weeks depending on your tech stack complexity.
Does Lantern replace my existing sales development tools?
No. Lantern integrates with your existing CRM, sales engagement platforms, and data sources to enhance their effectiveness rather than replace them.
How does Lantern measure ROI?
Lantern tracks multiple metrics including pipeline generated, meeting conversion rates, time saved by sales teams, and cost per qualified opportunity to provide a comprehensive view of ROI.
Is Lantern suitable for both enterprise and startup sales motions?
Yes. Lantern's flexible approach adapts to different sales motions, from high-volume startup outreach to complex enterprise account-based strategies.
How to transform Insurance Sales with AI-Powered Pipeline Intelligence
Insurance companies face unprecedented pressure from all sides. Customer expectations are rising, competition is intensifying, and the traditional methods of prospecting, selling, and retaining clients are showing their age. The old playbook of cold calling, manual CRM updates, and reactive customer service no longer delivers the growth insurers need.
The problem is clear: insurance sales teams are drowning in administrative tasks while missing their most valuable opportunities. When relationship managers spend up to 40% of their time on data entry and pipeline management rather than building client relationships, something needs to change.
Three Critical Challenges in Insurance Sales
1. The Champion Movement Problem
Insurance is fundamentally a relationship business. When key decision-makers—the champions who advocated for your policy or service—move to new companies, it represents both a significant risk and an enormous opportunity.
Industry data reveals that approximately 20% of insurance professionals change roles every year. This mobility matters tremendously because:
When champions leave current client companies, the renewal risk increases by 3x
When champions join new companies, they're 3x more likely to bring their trusted insurance providers with them
Yet most insurance companies have no systematic way to track these movements, resulting in millions in lost renewals and missed opportunities. Many insurers rely on insurance brokers remembering connections or manually checking LinkedIn profiles—a haphazard approach that inevitably leads to missed connections.
2. The Prospecting Efficiency Gap
Traditional insurance prospecting follows two inefficient paths:
Cold outreach: Sales representatives make largely untargeted calls or send generic emails to prospects who may not have any current interest in changing providers. This approach typically yields less than a 1% response rate and enormous wasted effort.
Inbound waiting game: Teams wait for potential clients to reach out—often far too late in the buying process, after they've already researched options and formed opinions. This passive approach surrenders competitive advantage and makes differentiation more difficult.
What's missing is the ability to identify high-intent prospects at the exact moment they're considering insurance options. Without this intelligence, even the most skilled sales teams struggle to focus their efforts efficiently.
3. The Data Disconnection Dilemma
Insurance companies have invested heavily in their tech stack—CRM systems, marketing automation platforms, customer success tools, and industry-specific software. However, these systems often exist in silos, creating fragmented data and an incomplete view of customer relationships.
This disconnection creates several critical problems:
Important customer information gets trapped in departmental silos
Sales teams lack visibility into marketing activities and vice versa
Renewal opportunities are missed due to incomplete account information
Cross-selling potential remains hidden beneath inaccessible data
Without a unified view of customer data, insurance companies struggle to deliver personalized experiences, protect renewals, and identify growth opportunities.
How AI Is Revolutionizing Insurance Sales Pipelines
Artificial intelligence is transforming how insurance companies manage their sales pipelines and customer relationships. Unlike traditional CRM systems that passively store data, AI-powered solutions actively monitor, analyze, and activate revenue opportunities.
Intelligence Beyond Data Storage
Modern AI solutions connect with the entire insurance tech ecosystem, from CRM to marketing automation and customer success platforms. This creates a single source of truth for all customer data, eliminating silos and ensuring no opportunity falls through the cracks.
As Harvey Rañola, Director of Digital Growth at a leading insurance provider, explains: "Within three months of implementing AI-powered pipeline intelligence, we're seeing pipeline that's 6-7x our investment, with potential for significantly more."
Automated Signal Detection
The most powerful AI platforms for insurance can automatically detect critical revenue signals, including:
Job changes: When key decision-makers move between companies
Digital intent: When prospects research insurance options on your website
Relationship networks: When existing clients connect with potential prospects
Competitive vulnerabilities: When competitors' clients show signs of dissatisfaction
These signals, once identified, can trigger automated workflows that ensure nothing falls through the cracks. For example, when a champion moves to a new company, the system can automatically update your CRM, alert the account manager, and suggest personalized outreach.
Intelligent Prospect Identification
Beyond reactive signal monitoring, advanced AI can proactively identify promising prospects based on ideal customer profiles. This capability transforms the prospecting process:
Automatically identifying key decision-makers at target accounts
Enriching contact data with accurate email addresses and phone numbers
Creating and updating contacts in your CRM
Triggering personalized outreach through your engagement platforms
For insurance teams targeting specific verticals or company sizes, this eliminates the manual prospecting burden, ensuring consistent pipeline generation with far less effort.
Building a Seamless Insurance Sales Pipeline with AI
For insurance companies, AI-powered workflows create a continuous cycle of opportunity detection and activation:
1. Unified Data Foundation
The foundation of an effective AI-powered sales pipeline is unified data. By connecting all your systems—CRM, marketing automation, customer success platforms, and industry-specific tools—AI creates a comprehensive view of your customer relationships.
This unified data foundation enables:
Complete visibility into customer interactions across all touchpoints
Accurate, real-time account information for all team members
Seamless collaboration between marketing, sales, and customer success
2. Intelligent Workflow Automation
With a solid data foundation in place, AI can automate critical workflows:
Job change detected → Update CRM → Alert account manager → Create personalized outreach sequence
Website intent signal → Score lead → Assign to appropriate team → Provide context and recommended next steps
Target account expansion → Identify missing stakeholders → Enrich contact data → Add to multi-threading campaign
These automated workflows ensure consistent execution, reducing manual tasks by up to 70% while improving response times and conversion rates.
3. AI-Enhanced Insights and Recommendations
Beyond automation, AI provides insurance teams with actionable intelligence:
Which accounts are most likely to convert based on engagement patterns
Which messaging and content resonates with specific personas
Which opportunities deserve immediate attention based on AI-powered scoring
This intelligence enables insurance sales teams to focus their efforts where they'll have the greatest impact, increasing productivity and results.
Real-World Impact: How Leading Insurers Are Using AI
Case Study: National Commercial Insurer
A national commercial insurance provider implemented AI-powered pipeline intelligence to track champion movements and identify opportunities within their existing customer base.
Challenge: The company was losing approximately 15% of renewals annually when key contacts changed jobs, with no systematic way to track these movements or capitalize on champions moving to new companies.
Solution: They implemented an AI-powered system that:
Monitored job changes across their entire customer base
Automatically updated their CRM with new contact information
Alerted account managers to both risks and opportunities
Suggested personalized outreach strategies
Results:
12 hours saved weekly on manual champion tracking and data management
$7.6M in new pipeline generated within the first 60 days
2.5x higher conversion rates on opportunities from AI-identified leads
15% reduction in churn by proactively identifying at-risk accounts
Case Study: Regional Health Insurance Provider
A regional health insurance provider used AI to improve their prospecting efficiency and focus on high-value opportunities.
Challenge: Their sales team was spending excessive time on low-probability prospects, resulting in inconsistent pipeline generation and missed growth targets.
Solution: They implemented an AI system that:
Identified high-intent prospects based on digital behavior
Enriched contact data automatically
Scored leads based on likelihood to convert
Triggered personalized outreach sequences
Results:
40% reduction in time spent on prospecting activities
3x increase in qualified opportunities
26.3% increase in win rates
9% increase in overall revenue
How Lantern's AI Agents Drive Insurance Sales Success
Lantern offers a specialized set of AI agents designed specifically for revenue intelligence and pipeline management. For insurance companies, Lantern's platform provides unique capabilities that address the industry's specific challenges.
Champion Agent
Lantern's Champion Agent automatically monitors job changes across your entire customer base, from current clients to open opportunities and even closed-lost accounts. When a key relationship changes companies, Lantern alerts you instantly.
Marina Ladonko, Enterprise Business Development leader, explains: "Champion Chaser not only saves us time—we're seeing results. We get alerted to job changes, connect with them on LinkedIn, and automatically add them to sequences with Workflow Builder. And best of all, we're getting higher response rates on our outreaches."
Intent Agent
Lantern's Intent Agent tracks digital buying signals across your web properties and third-party sources. This allows insurance teams to identify high-intent prospects at the exact moment they're considering options:
Decision-makers from target companies visiting your pricing pages
Current customers exploring new coverage options
Competitors' customers researching alternatives
When combined with automated workflow capabilities, these insights enable perfectly timed, highly relevant outreach.
Persona Tracker
Lantern's Persona Tracker automates the prospecting process for insurance teams targeting specific industries or company sizes. The system automatically identifies key decision-makers at target accounts based on your ideal customer profile, enriches their contact information, and sets up personalized outreach.
According to Shubh Sinha, Vice President at a leading insurance provider: "We were able to generate $7.6M in pipeline in the first 60 days—all thanks to Lantern. It's game-changing being able to leverage the Lantern CDP to integrate with all of our tools. It made Lantern a no-brainer."
The ROI of AI-Powered Pipeline Intelligence
Implementing AI-powered pipeline intelligence delivers measurable results for insurance companies:
Time Savings: Reduce administrative work by up to 70%, allowing teams to focus on relationship building
Pipeline Generation: Generate 3-5x more qualified opportunities through automated signal detection
Conversion Improvement: Achieve 2-3x higher conversion rates through better targeting and timing
Renewal Protection: Reduce churn by 15-20% by proactively identifying and addressing at-risk accounts
Insurance companies using advanced AI can expect an average ROI of 6-7x their investment within the first year, with increasing returns as the AI models continue to learn and improve.
The Insurance Sales Opportunity: Act Now
The insurance industry stands at a pivotal moment. Those who embrace AI-powered pipeline intelligence gain a significant competitive advantage, while those who stick with manual processes risk falling further behind.
Modern AI solutions like Lantern can be implemented quickly, with minimal IT resources required:
Connect your data sources: Integrate with your CRM, marketing tools, and customer success platforms
Configure your AI agents: Define your target personas, champion tracking parameters, and workflow rules
Activate your pipeline: Start receiving real-time alerts and recommendations
With dedicated support providing implementation assistance, training, and ongoing optimization, insurance companies can quickly transform their sales pipeline from a manual headache to an AI-powered competitive advantage.
The future of insurance sales belongs to companies that can detect and act on revenue signals faster than their competitors. With AI-powered pipeline intelligence, that future is here today.
Ready to transform your insurance sales pipeline?
What Is Signal-Based Selling? From Traditional to AI-Powered Revenue
Your prospects? They're drowning in a tsunami of 150+ cold emails. Every. Single. Day.
Customer acquisition costs? Through the roof.
But here's the plot twist – a new hero has emerged in the B2B sales world: signal-based selling.
Think of it as your sales team's secret weapon. No more spray and pray. No more hoping for a 1% response rate.
Welcome to the era of AI-powered, laser-focused sales intelligence.
Remember the evolution of music? From vinyl to Spotify? Sales has had its own revolution. We've moved from door-to-door in the '80s, to CRMs in the '90s, to today's AI-powered signal detection. It's like upgrading from a flip phone to the latest iPhone – there's just no comparison.
But what exactly is signal-based selling? Imagine having a crystal ball that tells you exactly when a prospect is ready to buy. That's what we're talking about. Instead of cold calling hundreds of uninterested prospects, you're focusing on the ones actually raising their hands – virtually, of course.
Here's where it gets exciting: modern platforms can track buying signals across more than 30 different tools.
Website visits? Tracked.
Product usage patterns? Monitored.
Job changes? Flagged.
It's like having a team of digital detectives working 24/7 to spot your next best opportunity...Let's dive in!
Why Traditional Outbound Sales Is No Longer Effective
The traditional outbound sales model is breaking down for several critical reasons. The statistics paint a stark picture of the current situation, revealing three major challenges that are reshaping the sales landscape.
Email saturation has reached unprecedented levels in today's digital environment. Decision-makers are now drowning in their inboxes, receiving over 150 cold emails weekly. This overwhelming volume has led to dramatically diminished effectiveness, with average cold email response rates plummeting to a mere 1%. The constant barrage of unsolicited messages has created severe inbox fatigue, resulting in increased buyer resistance and rapidly eroding trust in traditional outreach methods.
The financial impact of traditional sales approaches has become increasingly unsustainable. Customer acquisition costs (CAC) have skyrocketed, showing a threefold increase over just the last two years. Organizations are finding themselves trapped in a cycle of escalating investments in traditional prospecting methods, while the return on investment for cold outreach continues to decline. This cost explosion is forcing companies to reconsider their entire approach to sales and customer acquisition.
Buyer behavior has undergone a fundamental transformation. Modern B2B buyers now conduct extensive independent research before even considering engagement with sales representatives. These decision-makers have developed sophisticated expectations, demanding highly personalized interactions that demonstrate a deep understanding of their specific needs and challenges. In this environment, generic cold outreach is not just ineffective – it's often seen as intrusive and unprofessional, potentially damaging the sender's reputation and future opportunities for engagement. This shift in buyer behavior makes it clear that the era of traditional cold outreach is coming to an end, necessitating a more intelligent, signal-based approach to sales.
Types of Buying Signals in Modern B2B Sales
Successful signal-based selling relies on detecting and acting upon various types of buying signals. Here's a comprehensive breakdown of the key signals modern sales teams should monitor:
Champion Movement Signals
Job changes across your customer base
Former customers moving to new companies
Key contacts from closed/lost opportunities changing roles
Decision-makers taking new positions at target accounts
Champion departures that could impact current deals
Intent Signals
Website visits to pricing and product pages
Increased product usage patterns
Engagement with marketing content
Multiple stakeholders from the same company showing interest
Return visits from previously closed/lost opportunities
Demo page interactions
Company Growth Signals
New executive hires in target accounts
Funding rounds and financial events
Office expansions or new location openings
Technology stack changes
Hiring patterns in relevant departments
Buying Committee Signals
Formation of new buying committees
Additional stakeholders joining the evaluation process
Role changes within existing accounts
Missing stakeholder identification
Multi-threading opportunities
How to Implement Signal-Based Selling in Your Organization
Implementing signal-based selling requires a strategic approach and the right technological infrastructure. Success depends on a well-planned, systematic implementation that addresses four key areas of focus.
The foundation of successful signal-based selling begins with comprehensive data unification. Organizations must first connect all their customer-facing systems, including CRM, marketing automation, and product analytics platforms into a cohesive ecosystem. This integration requires establishing robust bi-directional data synchronization across platforms to ensure information flows seamlessly throughout the organization. Additionally, implementing thorough data enrichment processes ensures complete contact information is always available. The final piece of this foundation involves maintaining clean data through sophisticated duplicate prevention and standardization mechanisms, creating a single source of truth for all customer interactions.
Once the data infrastructure is in place, organizations must focus on signal definition and prioritization. This crucial phase involves carefully identifying which signals matter most for your specific business context and creating sophisticated scoring systems to evaluate different types of signals. Companies need to clearly define trigger events that require immediate action and establish comprehensive signal qualification criteria. This framework ensures that sales teams can quickly identify and act on the most promising opportunities while maintaining efficiency in their operations.
Connect your CRM, marketing automation, and product analytics into a single source of truth - then let AI detect and activate every revenue signal.
Workflow development represents the next critical phase of implementation. Organizations need to create standardized processes for signal response that can be consistently applied across the sales team. This includes setting up intelligent automated routing rules based on territories and expertise, ensuring each opportunity reaches the right team member. Comprehensive playbooks must be developed for different signal types, providing clear guidance on how to respond to each opportunity. The final piece involves implementing multi-channel activation strategies that allow teams to engage prospects through their preferred communication channels.
The final and ongoing component of successful implementation is team training and adoption. Sales teams must be thoroughly trained in signal recognition and response, ensuring they understand how to interpret and act on different types of signals effectively. Organizations should establish clear best practices for personalized outreach that align with their overall sales strategy. Creating robust feedback loops enables continuous improvement of the system, while regular monitoring and optimization of signal response rates helps maintain peak performance. This commitment to ongoing training and optimization ensures the long-term success of your signal-based selling initiative.
The Role of AI and Automation in Signal-Based Selling
Artificial intelligence has become crucial in making signal-based selling scalable and effective. Modern AI-powered systems offer several key capabilities:
Signal Detection and Processing
Automated monitoring across multiple platforms
Real-time signal detection and classification
Intelligent prioritization based on conversion likelihood
Pattern recognition for complex signal combinations
Data Enrichment and Research
Automated contact and company data enrichment
Buying committee mapping and relationship analysis
Company news and funding monitoring
Technology stack detection and analysis
Intelligent Routing and Activation
Smart territory management and lead routing
Automated workflow triggering
Multi-channel activation capabilities
Personalized outreach recommendations
Predictive Analytics
Conversion probability scoring
Opportunity value prediction
Optimal timing recommendations
Relationship strength assessment
Measuring Success in Signal-Based Selling: Key Metrics and ROI
Organizations implementing signal-based selling have reported significant improvements in key performance metrics, demonstrating the transformative impact of this approach across multiple dimensions of sales performance.
On the efficiency front, the results are compelling. Teams consistently report saving an average of 12 hours weekly on manual tracking tasks, allowing sales representatives to focus more time on meaningful customer interactions. The automation capabilities have led to a threefold increase in captured opportunities, while manual data entry and routing have been reduced by an impressive 80%*. Perhaps most significantly, teams have experienced a 70% decrease in time spent switching between tools, streamlining their workflow and improving overall productivity.
Organizations implementing signal-based selling have reported 3X more captured opportunities and 70% less time spent on manual tasks*
Performance metrics tell an equally impressive story of revenue impact and sales effectiveness. Organizations have documented a substantial 26.3% increase in sales team win rates after implementing signal-based selling strategies. Revenue has grown by an average of 9%, with many companies achieving a remarkable 6-7x ROI within just the first three months of implementation. One particularly noteworthy statistic reveals that 70% of new buyers' budgets are captured within their first 100 days, highlighting the importance of timing and rapid engagement in the modern sales landscape.
The success of signal-based selling can be tracked through several crucial key performance indicators that provide deeper insights into the methodology's effectiveness. Teams closely monitor their signal-to-opportunity conversion rates, analyzing how effectively they transform detected signals into viable sales opportunities. Response rates from signal-based outreach consistently outperform traditional cold outreach, while pipeline generation metrics help teams understand which signal types yield the best results. Time to first contact after signal detection has become a critical metric, as has the success rate of multi-threading strategies within target accounts.
Looking at the long-term impact, organizations are experiencing benefits that extend far beyond immediate sales metrics. Customer retention has improved significantly through the early detection of warning signals that allow proactive engagement before issues escalate. Companies have strengthened their competitive position through enhanced market intelligence, while more effective resource allocation has led to optimized team performance. Perhaps most importantly, teams report higher levels of satisfaction and productivity, as they spend more time on high-value activities and less on administrative tasks. This combination of immediate results and lasting organizational improvements demonstrates the comprehensive value proposition of signal-based selling as a long-term sales strategy.
The Future of Signal-Based Selling
As we continue into the AI-powered, signal-based era of sales, several trends are emerging:
Enhanced AI Capabilities
More sophisticated signal detection algorithms
Improved personalization capabilities
Advanced predictive analytics
Automated research and enrichment
Expanded Signal Sources
Integration with new data sources
Enhanced social signals detection
Deeper intent data analysis
Improved buying committee mapping
Increased Automation
Automated workflow optimization
Smart playbook selection
Intelligent content personalization
Predictive lead routing
Organizations that adapt to this new approach will find themselves better positioned to succeed in an increasingly competitive marketplace. The combination of comprehensive signal detection, AI-powered intelligence, and automated workflows creates a powerful foundation for modern sales success. As technology continues to evolve, signal-based selling will become even more sophisticated, offering new opportunities for sales teams to connect with potential customers at the right time with the right message.
Ontology is all you need
Coding agents work. Not demo-work. Actually work. Engineers hand off tickets, get back working code, merge it, move on. Support agents are close behind, resolving real tickets without a human in the loop.
Everything else: demos that dazzle, pilots that fizzle, production that requires a human to redo the work. Same models, same capabilities. So what do coding and support have that nothing else does?
Most people say training data. GitHub is massive, support knowledge bases are structured, models got good at these things because they saw a lot of them. There's truth in that. But it's not the real answer.
The real answer is context. A codebase is a self-contained world. Point an agent at a repo and every fact it needs is already there. Types tell it what things are. Tests tell it what things should do. Imports tell it how things connect. Git history tells it why things changed. Without anyone intending it, programmers built a complete ontology: a machine-readable map of a small universe, its entities, their relationships, and the rules governing them.
But it gets better. A codebase also comes with a labeled training set. A Jira ticket is a prompt: here's what I want, here's the acceptance criteria. A merged pull request is the approved output: here's the correct response, reviewed by a human. Thousands of these pairs, generated organically over years, sitting right there in the issue tracker and git log.
The same labeled pairs exist in every profession. An analyst's inbox is full of "MD asked for a model, here's the version that went to the client." A lawyer's email history contains "client asked a question, partner approved this answer." The training data is everywhere. It's just not anywhere a machine can reach it. Yet.
Context is what makes agents smart regardless of the model underneath. Give an agent complete context and a mediocre model will outperform a frontier model running blind. This is what the benchmarks miss. They test capability in a vacuum. Production tests capability with whatever context you can scrounge together.
In the enterprise, context is a disaster.
We spent the last fifteen years buying SaaS. Hundreds of tools, each best-in-class at one thing. Gong for calls. HubSpot for campaigns. Salesforce for pipeline. Zendesk for tickets. Amplitude for usage. Jira for feature requests. Stripe for payments. Google Analytics for acquisition. Notion for strategy docs.
Then there's the stuff that doesn't fit neatly into any tool. The Slack thread where your team debated whether to give a customer a discount. The email the CEO sent personally after a rough QBR. The offhand comment on a Zoom that changed the product roadmap. All of it is customer data. Almost none of it is reachable.
So what would it take to give an enterprise agent the same complete picture a codebase gives a coding agent?
Every piece of data in a business connects back to one of two things: a customer or an employee. That's it. Pipeline, revenue, support tickets, campaign performance, churn analysis: customer. Payroll, provisioning, compliance, headcount: employee. Every SaaS tool in the stack is a different view of data that ultimately joins on one of these two keys.
At a high level, a business does two things: get new customers and serve existing ones. There is no third thing. Finance exists to measure it. Product exists to enable it. Marketing exists to drive it. Strategy exists to direct it. Every function, every workflow, every decision traces back to the customer.
Now here's the problem. Everyone assumed Salesforce was the customer ontology. The system of record. The source of truth.
It isn't. 80% of customer data lives outside the CRM. Salesforce has deal stages and whatever a rep logs after a call. The actual customer relationship, what they said on the discovery call, what frustrated them in onboarding, which feature they begged for, why they almost churned, lives in Gong, Zendesk, Slack, email, product analytics. Salesforce is a scoreboard. It tells you the score. It can't tell you how the game was played or what to do next.
A scoreboard is not an ontology.
But the raw material for a real customer ontology already exists. The calls are recorded. The emails are logged. The support tickets are timestamped. The product usage is streaming. The data is in the cloud, scattered across dozens of systems, waiting to be unified.
Whoever gathers all of the data about acquiring and serving customers into a single, machine-readable graph builds the codebase equivalent for the rest of the business. That's the platform that automates white-collar work. Not because of a better model. Because of a better ontology.
Not the model layer. Not the agent layer. The meaning layer.
Some people call this a revenue ontology. We just call it the future of enterprise software.
Why Your Active Deals Are Sending Buying Signals You're Missing
When a sales cycle stalls, most teams blame external factors: budget constraints, changing priorities, or competitive pressure. What if the real culprit is simpler and more fixable? What if your prospects are actually signaling their continued interest—but your team is missing these critical signals?
The Invisible Intent Gap in Active Sales Cycles
Most sales teams are laser-focused on traditional engagement metrics: email opens, meeting attendance, and CRM activity. Meanwhile, 70% of actual buying intent signals occur outside these tracked channels, creating a dangerous blind spot for deals already in your pipeline.
Consider this scenario: Your champion hasn't responded to emails in two weeks, but three other stakeholders from the account have visited your pricing page seven times in the past 48 hours. Without this intelligence, your rep might be ready to mark the opportunity as "at risk"—exactly when the buying committee is showing peak interest.
The Three Critical Moments Most Teams Miss
1. The Technical Deep Dive
When technical stakeholders return to product pages after formal demos, it signals serious evaluation. Research shows that 83% of technical validation happens independently, without the sales rep's knowledge.
These self-guided technical explorations often predict deal momentum better than meetings or email interactions. When a prospect's engineering team spends 45 minutes on your API documentation after an initial call, they're not casually browsing—they're validating your solution against requirements.
2. The Price Check Signal
The most revealing signal of all? Return visits to pricing pages. When multiple stakeholders from an active opportunity repeatedly view pricing information, they're typically:
Preparing budget justification
Comparing different tiers or packages
Building internal business cases
Preparing for negotiation
Yet most companies have no visibility into this behavior until it's too late to capitalize on the momentum.
3. The Silent Researcher
A particularly valuable signal comes from what we call "The Silent Researcher"—a stakeholder who never appears on calls but extensively researches your solution. Often, this person is:
The economic buyer who stays behind the scenes
A technical evaluator conducting due diligence
A procurement specialist preparing for negotiations
Without proper intent tracking, these invisible but crucial decision-makers remain undetected throughout the sales process. When they eventually surface with objections or requirements, sales teams are caught completely off-guard.
The Revenue Impact of Missed Signals
The financial consequences of missed intent signals in active opportunities are substantial:
Deal velocity slows by 37% when teams fail to respond to buying intent signals within 24 hours
Win rates decrease by 23% for opportunities where technical stakeholder research goes unnoticed
Deal size shrinks by 18% when pricing exploration signals aren't leveraged for upsell conversations
These aren't small efficiency gains—they represent fundamental revenue leakage in your sales process.
From Reactive to Proactive Opportunity Management
Forward-thinking teams are moving beyond basic pipeline management to dynamic opportunity intelligence. This shift involves:
Comprehensive signal tracking across your entire digital ecosystem
Real-time alerts when key stakeholders engage with critical content
Contextual intelligence that maps engagement to specific buying stages
Prescriptive next steps based on the type and intensity of signals
When a technical stakeholder revisits your security documentation, the ideal response isn't the same as when the economic buyer reviews pricing options. Different signals demand different selling motions.
Lantern's Open Opps Intel: Turning Signal Detection into Revenue
This is precisely why we built Lantern's Open Opps Intel agent. It tracks when contacts from active opportunities interact with your critical selling resources, providing immediate alerts and actionable context to your team.
The agent not only captures the "who" and "what" of engagement but also interprets the buying intent behind each interaction. By analyzing behavioral patterns across the entire buying committee, it helps reps understand:
Which deals show true momentum vs. which are stalling
Which stakeholders are actively researching your solution
Which content is resonating with technical vs. economic buyers
Which objections are likely being researched behind the scenes
Sales teams using Lantern's Open Opps Intel report:
28% acceleration in deal velocity for active opportunities
41% improvement in accurately forecasting deal close dates
19% increase in average deal size through better timing of upsell conversations
From Data to Action: What This Means for Your Team
With proper intent signal detection, your team can transform their selling approach:
1. Timing-Based Outreach
When a prospect shows renewed interest after a period of silence, that's the optimal moment for re-engagement—not the arbitrary "checking in" emails most reps send on a predetermined schedule.
2. Content-Based Personalization
If a technical stakeholder downloads your security whitepaper, your next communication should address those specific concerns—not generic value propositions.
3. Multi-Threaded Engagement
When new stakeholders from an account begin researching your solution, it's time to expand your selling motion to include them—even if your champion hasn't made the introduction.
4. Priority-Based Time Allocation
Not all opportunities deserve equal attention. When multiple stakeholders from an account show intense research activity, that opportunity should immediately rise to the top of your rep's priority list.
Conclusion: The Future of Intent-Based Selling
The most sophisticated sales organizations are no longer simply "working their pipeline"—they're orchestrating precise responses to buyer signals across their entire opportunity landscape.
By implementing Lantern's Open Opps Intel agent, teams gain the ability to:
See exactly which active deals are showing genuine buying momentum
Identify the specific stakeholders actively engaged in the buying process
Understand which content and topics are driving buying decisions
Time their outreach to perfectly align with peaks in buyer interest
In the age of digital buying, the winners won't be those who simply work harder—it will be those who can interpret and act on the intent signals their prospects are already sending.
Interested in learning how Lantern's Open Opps Intel agent can transform your team's ability to capitalize on buying signals from active opportunities? Book a demo today to see the power of AI-driven intent tracking in action.
Why B2B Teams Need a GTM Intelligence Layer
The modern B2B tech stack is breaking. As CAC continues to skyrocket (up 60% in the last six years according to Boston Consulting Group) and buying committees grow more complex, revenue teams find themselves drowning in disconnected tools that create more problems than they solve. The promise of digital transformation has led to digital chaos, with the average enterprise now using over 440 different SaaS applications across their GTM functions.
But here's the truth nobody's talking about: adding more point solutions isn't the answer. The future of revenue generation lies not in more tools, but in connecting and activating the data you already have through an intelligent layer that spans your entire GTM operation.
The Hidden Cost of Point Solution Proliferation
The symptoms are familiar to any revenue leader:
Sales reps jumping between 6-7 different tools just to research a single prospect
Marketing campaigns running in silos, disconnected from sales intelligence
Customer success working with outdated or incomplete account information
Critical buying signals lost in the noise of disconnected systems
But the real cost goes beyond mere inefficiency. According to recent studies, companies lose up to 30% of their revenue potential to poor tool integration and data silos. In today's market, where every customer interaction counts, this is a price too high to pay.
Why Traditional Integration Isn't Enough
Many organizations have attempted to solve this problem through point-to-point integrations or data warehouses.
While these approaches can help move data between systems, they fall short in three critical ways:
They're Static: Traditional integrations move data but don't make it actionable. Having customer data in your CRM isn't valuable if your teams can't easily understand and act on it.
They're Rigid: Most integration solutions are built for specific use cases and struggle to adapt as your GTM motion evolves.
They Lack Intelligence: Moving data between systems is only the first step. Without an intelligence layer to analyze and activate that data, you're still leaving value on the table.
The Intelligence Layer: A New Paradigm for GTM Operations
An intelligence layer is more than just another tool in your tech stack—it's a fundamental shift in how revenue teams operate. Think of it as the brain of your GTM operation, connecting disparate systems while adding the crucial element of intelligence that turns data into action.Key Components of an Effective Intelligence Layer
Unified Data Foundation
Real-time data synchronization across all GTM tools
Automatic data cleansing and enrichment
Single source of truth for customer information
Intelligent Signal Detection
Automated monitoring of buyer intent signals
Real-time tracking of account changes and opportunities
Proactive identification of risks and opportunities
Automated Workflow Orchestration
Intelligent routing of opportunities to the right teams
Automated follow-up sequences based on buyer behavior
Cross-functional workflow automation
Predictive Analytics and Insights
AI-powered opportunity scoring
Predictive account health monitoring
Revenue forecasting and trend analysis
The Business Impact of an Intelligence Layer
Organizations that successfully implement an intelligence layer see transformative results:
1. Improved Revenue Efficiency
40-60% reduction in time spent on manual data entry
25-35% increase in sales productivity
15-20% improvement in campaign conversion rates
2. Enhanced Customer Experience
Consistent messaging across all channels
Faster response times to customer needs
More personalized interactions at scale
3. Better Decision Making
Real-time visibility into pipeline health
More accurate revenue forecasting
Data-driven resource allocation
Common Pitfalls to Avoid
As organizations move to implement an intelligence layer, there are several common mistakes to watch out for:
Starting Too BigInstead of trying to transform everything at once, focus on specific high-impact use cases and expand from there.
Ignoring Change ManagementThe best technology won't matter if your teams don't adopt it. Invest in proper training and change management.
Neglecting Data QualityAn intelligence layer is only as good as the data it works with. Ensure you have a solid data governance strategy in place.
Building Your Intelligence Layer Strategy
Step 1: Assess Your Current State
Map your existing tech stack
Identify key data silos and integration gaps
Document manual processes that could be automated
Step 2: Define Your Objectives
Set clear goals for what you want to achieve
Prioritize use cases based on business impact
Establish KPIs to measure success
Step 3: Choose the Right PlatformLook for solutions that offer:
Comprehensive data integration capabilities
AI-powered automation and insights
Flexible workflow configuration
Enterprise-grade security and compliance
Proven scalability
The Lantern Approach: Intelligence Layer Done Right
While many vendors claim to offer intelligence layer capabilities, Lantern stands apart through its comprehensive approach to revenue intelligence. Built from the ground up to serve as a true intelligence layer, Lantern combines:
Complete Signal Coverage: Real-time monitoring across 50+ tools and data sources
AI-Powered Workflows: Intelligent automation that goes beyond simple rules
Enterprise-Grade Intelligence: Fully customizable workflows with granular controls
But what truly sets Lantern apart is its ability to deliver immediate value while scaling with your organization. Unlike point solutions that solve single problems, Lantern's intelligence layer grows more valuable as you use it, continuously learning and adapting to your unique GTM motion.
Looking Ahead: The Future of GTM Technology
The future of GTM technology isn't about adding more tools—it's about making your existing stack work smarter. As we move into an era of AI-driven revenue operations, the organizations that thrive will be those that successfully implement an intelligence layer to unite their GTM stack.
Key Trends to Watch:
Increased focus on workflow automation and orchestration
Growing importance of predictive analytics in GTM decisions
Rise of AI-powered personalization at scale
Shift toward unified customer data platforms
Taking the Next Step
As you evaluate your GTM tech stack and consider implementing an intelligence layer, ask yourself these key questions:
How much time do your teams spend switching between tools?
How many opportunities are you missing due to disconnected systems?
What would be possible if your entire GTM stack worked as one?
The answers to these questions will help guide your journey toward a more intelligent, unified GTM operation.
Conclusion
The era of point solutions is ending. In today's complex B2B landscape, success requires more than just a collection of tools—it requires an intelligent layer that can unite, analyze, and activate your entire GTM stack. Organizations that recognize and act on this shift will find themselves well-positioned for success in the evolving B2B landscape.Whether you're just starting to explore the concept of an intelligence layer or ready to take the next step in your GTM evolution, the time to act is now. The cost of maintaining the status quo—in terms of lost opportunities, inefficient operations, and growing GTM bloat—is simply too high to ignore.
Understanding Buying Signals: How to Track and Use Data
In today's hyper-competitive business landscape, the ability to identify and act on buying signals has become a critical differentiator between high-performing sales organizations and their competitors. Organizations that effectively utilize buying signals have reported a 10% to 20% increase in new opportunities, while simultaneously reducing their customer acquisition costs by up to 30%. This evolution in sales intelligence represents a fundamental shift in how successful organizations approach customer engagement and pipeline development.
The transformation from traditional sales approaches to signal-based selling isn't just about adopting new technology—it's about fundamentally changing how organizations understand and respond to customer behavior. In an era where buyers complete up to 80% of their journey before engaging with sales representatives, the ability to detect and interpret buying signals has become essential for survival and growth.
What Are Buying Signals?
Buying signals are indicators that suggest a potential customer's readiness to make a purchase decision. These signals manifest throughout the buyer's journey, ranging from subtle signs of initial interest to explicit declarations of purchase intent. Understanding these signals has become increasingly complex as buyer behavior evolves across multiple digital and traditional channels.
Modern buying signals extend far beyond traditional indicators like direct inquiries or budget discussions. They now encompass digital body language, engagement patterns, and organizational changes that might indicate buying potential. This evolution requires sales teams to develop more sophisticated approaches to signal detection and interpretation, combining technological capabilities with human insight.
The Strategic Impact of Buying Signals
The impact of effective buying signal tracking extends throughout the entire sales organization, transforming how teams identify, pursue, and close opportunities. When properly implemented, a buying signals strategy fundamentally changes the economics of sales operations. Organizations typically see reduced sales cycles, improved conversion rates, and more efficient resource allocation.
More importantly, effective signal tracking changes the nature of customer relationships. Instead of relying on interruptive outreach, sales teams can engage prospects at moments of genuine interest and need. This transformation leads to more meaningful conversations, better solution alignment, and ultimately, higher customer satisfaction and retention rates.
Types of Buying Signals and Their Significance
The landscape of buying signals is diverse and nuanced, requiring careful interpretation and strategic response. Explicit signals, such as demo requests or pricing inquiries, represent clear interest but must be understood within the broader context of the prospect's journey. When a potential customer takes such direct action, it often indicates they're in an active evaluation phase, making timing and response crucial.
Implicit signals require more sophisticated interpretation but often provide deeper insights into prospect needs and intentions. These might include patterns of content consumption, technical documentation reviews, or specific feature investigations. While less obvious than explicit signals, these behavioral indicators often reveal genuine interest and specific pain points that sales teams can address.
Organizational buying signals add another layer of complexity to signal interpretation. Changes in leadership, new strategic initiatives, or shifts in company direction can all indicate potential opportunities. However, these signals require careful validation and often benefit from correlation with other signal types to confirm their significance.
Signal Scoring and Prioritization
The art and science of signal scoring represents a crucial capability for modern sales organizations. Effective scoring systems combine multiple factors to assess signal strength and buying intent, enabling teams to prioritize their efforts for maximum impact. The most sophisticated systems incorporate both behavioral data and contextual information to generate meaningful insights.
Signal strength indicators must account for recency, frequency, and depth of engagement. A prospect who deeply engages with technical content over time typically shows stronger buying intent than one who briefly skims multiple resources. Similarly, engagement from multiple stakeholders within an organization often indicates more serious buying intent than isolated interactions from single individuals.
Modern scoring systems also need to consider the prospect's fit with ideal customer profiles and their level of authority in the buying process. This holistic approach ensures that high scores represent not just interest, but genuine opportunity aligned with organizational capabilities and goals.
The Role of Time in Signal Interpretation
Time is perhaps the most critical yet overlooked dimension in signal interpretation. The value and relevance of buying signals decay at different rates, requiring sales organizations to develop sophisticated response frameworks that account for these varying lifespans. Understanding these temporal patterns can mean the difference between capitalizing on a prime opportunity and missing it entirely.
Immediate response signals, such as demo requests or pricing inquiries, represent the most time-sensitive category. These signals indicate active buying interest and require rapid response protocols. When a potential customer takes the time to request a demo or specific pricing information, they're typically evaluating multiple solutions simultaneously. Research shows that organizations responding within the first hour of receiving such signals are seven times more likely to qualify the lead than those waiting even sixty minutes longer.
Short-term signals, while less urgent, still require structured follow-up protocols. These signals often manifest through content engagement, website visits, or event registrations. The key to effectively managing short-term signals lies in understanding their context within the broader buyer journey. For instance, a prospect downloading a technical whitepaper might not need immediate sales contact, but their interest should be nurtured through relevant content and touchpoints over the following days or weeks.
Long-term signals require the most nuanced approach. These typically emerge through industry research, technology evaluations, or strategic initiatives that might take months to develop into concrete opportunities. Success with long-term signals depends on maintaining consistent, value-added engagement without appearing overly aggressive. This might involve quarterly check-ins, sharing relevant industry insights, or providing updates about product developments that align with the prospect's known interests.
Cultural and International Considerations
The interpretation and handling of buying signals vary dramatically across different cultures and regions, making it essential for global organizations to develop nuanced approaches to signal interpretation. What might be considered a strong buying signal in one culture could be meaningless or even counterproductive in another, requiring sales teams to develop cultural intelligence alongside their technical expertise.
In Western markets, particularly in North America, buying signals often manifest through direct communication and explicit interest. Prospects typically follow a more linear buying process, with clear stages and direct feedback. Decision-makers are more likely to engage in straightforward discussions about needs, budgets, and timelines. This directness extends to digital behavior, where actions like downloading pricing information or requesting demos are reliable indicators of buying intent.
Asian markets present a markedly different landscape, where relationship building and indirect communication dominate the buying process. Signals in these markets often emerge through subtle cues and relationship dynamics rather than explicit statements of interest. The emphasis on consensus and harmony means that negative signals might be particularly difficult to detect, as prospects may avoid direct confrontation or rejection. Success in these markets requires sales teams to pay attention to contextual clues and invest time in understanding the broader organizational dynamics at play.
European markets occupy a middle ground, combining elements of both direct communication and formal process adherence. The emphasis on compliance and regulation means that buying signals often emerge through technical and legal due diligence processes rather than traditional sales interactions. Understanding these regional variations is crucial for global organizations looking to accurately interpret and act on buying signals across different markets.
Building the Right Team
The foundation of effective buying signal tracking lies in assembling and organizing the right team. This goes beyond simply hiring analysts or sales professionals; it requires building a cross-functional unit that combines analytical capabilities with deep market understanding and technical expertise.
Signal analysts form the backbone of the team, bringing advanced analytical capabilities and pattern recognition skills. These professionals need to combine statistical knowledge with business acumen, enabling them to distinguish meaningful signals from market noise. They work closely with response coordinators, who manage the tactical execution of signal-based initiatives and ensure that insights translate into action.
Technology specialists play a crucial role in maintaining and optimizing the technical infrastructure that enables signal tracking. Their responsibilities include system integration management, data quality assurance, platform optimization, and technical troubleshooting. The effectiveness of the entire signal tracking operation depends on the reliability and efficiency of these technical foundations.
Sales enablement professionals serve as the bridge between analysis and action, transforming raw signal data into actionable sales intelligence. They develop playbooks, training materials, and response protocols that help sales teams maximize the value of identified signals.
Measuring Success and ROI
The effectiveness of buying signal tracking must be measured through both quantitative metrics and qualitative assessments to provide a complete picture of its impact on the organization. This multifaceted approach to measurement ensures that both immediate results and long-term value creation are properly captured and evaluated.
At its core, successful signal tracking should lead to measurable improvements in sales efficiency and effectiveness. Organizations typically see reductions in sales cycle length ranging from 20% to 40% when properly implementing signal tracking systems. These improvements stem from better prospect prioritization and more timely engagement, allowing sales teams to focus their efforts on opportunities with the highest likelihood of conversion.
Revenue impact represents another crucial dimension of signal tracking success. Companies with mature signal tracking capabilities often report increases in average deal size and improved win rates. This occurs because sales teams can engage prospects at more opportune moments and with more relevant offerings, leading to better alignment between solution and need.
The long-term strategic value of signal tracking extends beyond immediate sales metrics. Organizations develop deeper market intelligence, stronger customer relationships, and more precise competitive positioning through systematic signal tracking and analysis. These benefits, while harder to quantify, often prove more valuable than the direct revenue impact over time.
Future Trends in Buying Signals
The landscape of buying signal tracking continues to evolve rapidly, driven by advances in technology and changes in buyer behavior. Artificial intelligence and machine learning are transforming how organizations detect and interpret signals, enabling more sophisticated pattern recognition and predictive capabilities. These technologies are particularly valuable in identifying subtle signals that human analysts might miss and in scaling signal tracking across large volumes of data.
The rise of digital-first buying behaviors is also reshaping signal tracking. As more of the buying process moves online, new types of signals emerge while traditional indicators may become less relevant. Organizations must adapt their signal tracking capabilities to capture and interpret these emerging digital behaviors effectively.
Conclusion
The mastery of buying signals represents a fundamental shift in how organizations approach sales and customer engagement. Success requires a balanced approach combining technology, process, and human insight. Organizations that excel in signal tracking will find themselves better positioned to identify opportunities earlier, engage prospects more effectively, and build stronger customer relationships.
The future of sales lies in the ability to not just collect signal data, but to transform it into meaningful insights and actions that drive business growth. Organizations that invest in developing these capabilities now will be best positioned to thrive in an increasingly competitive marketplace.
By maintaining a comprehensive approach to buying signals—one that considers technical, organizational, and human factors—companies can build robust systems that drive measurable improvements in sales performance and customer satisfaction. The key lies not in any single technology or process, but in developing an integrated approach that aligns with organizational goals and customer needs.
Execution Gap
Every CMO knows what campaign they want to run. The strategy is ready on day one.
What kills it is everything between the brief and the launch. A brief goes to the agency, the agency comes back with creative, the creative goes back for revisions, and then it's media buying and legal review and another round of notes and a reshoot and finally – six weeks after someone had the idea – the ads go live. The moment's gone. The market moved. The insight that sparked the campaign is stale.
This is the execution gap. And every marketing org in the world is trapped in it.
It's not a people problem. The people are great. It's an output problem that everyone has been solving by hiring more people. The 500-person marketing org wasn't built because marketing is intrinsically a 500-person job. It was built because execution used to be time consuming.
Launching a campaign shouldn't be this hard. We know because we've watched it get easy somewhere else.
Agents work for engineering. Engineers hand off tickets and come back to working code that actually merges. Nothing else does. Every other agent product is a demo that falls apart the second you try to use it in production. Same underlying models, same capabilities, totally different outcome. The gap isn't the model: it's the context.
A codebase is a complete world an agent can reason over. Types, tests, imports, git history. Without meaning to, programmers built the first real ontology: a machine-readable map of every entity, every relationship, every rule that governs how the system works. Hand an agent a codebase and every fact it needs is already there.
Hand an agent a marketing team and it's working blind.
The customer insights are in Gong. The campaigns are in HubSpot. The pipeline is in Salesforce, which everyone treats as the source of truth even though 80% of the actual customer relationship lives somewhere else entirely – in a Slack thread from three months ago, in an email nobody remembers, in a product analytics tool three people on the team have access to. That's why every "AI for marketing" product you've seen is a demo. The models are fine. The context is broken.
We fixed the context.
Lantern is the first revenue ontology platform. We unify every piece of customer data across every system your company runs – first party, third party, structured, unstructured – into a single machine-readable graph. Then we put agents on top of it. Not one agent pretending to be a marketer, but a library of them, each built for a specific piece of the work.
I wrote the long-form argument for why ontology is the whole ballgame last week. If you want the technical foundation, it's here. This post is about what happens once you have it.
Give Lantern a brief and it comes back with the campaign. In 10 minutes or less. Ads, landing pages, email sequences, social, competitive teardowns, the whole thing. Not a draft – a shipped campaign, on-brand and in most cases better than what your current team would produce because it can reach context your current team can't.
We're working with a Fortune 500 company whose marketing department has more than 3,000 people. During the pilot, leadership asked us not to present the work to the marketing team. Not because the work was bad. Because it was too good – and they hadn't decided what kind of organization they wanted to be on the other side.
That's the decision every B2B marketing org is about to face. Not whether this technology works. It works. The decision is what you do with it.
Path one: use it to cut. Shrink the team, pocket the savings, keep running the same campaigns with fewer people. The budget that used to pay for execution now goes into channels. Some companies will do this; Dorsey laid off 50% of Square employees last month.
Path two: use it to attack. Keep your best people – the strategists, the creatives, the operators who actually understand your market – and unleash them. Launch 10x more campaigns. Personalize every one of them. Run the wild ideas that used to die in prioritization because they were too expensive, too ambitious, too operationally complex. The hours that used to go into building campaigns now go into imagining better ones.
We are about to enter the golden age of marketing. More creative. More ambitious. More personal. "It costs too much, it's too ambitious, it takes too much time" – those are complaints of the past.
To every CMO in the global 2000: you need to decide which path you're on. The companies that move first get to choose how this lands. The companies that wait get the decision made for them.
You don't have to believe me.
Text +1 (650) 222-1296 and chat with a Lantern agent.
Ontology is all you need
Coding agents work. Not demo-work. Actually work. Engineers hand off tickets, get back working code, merge it, move on. Support agents are close behind, resolving real tickets without a human in the loop.
Everything else: demos that dazzle, pilots that fizzle, production that requires a human to redo the work. Same models, same capabilities. So what do coding and support have that nothing else does?
Most people say training data. GitHub is massive, support knowledge bases are structured, models got good at these things because they saw a lot of them. There's truth in that. But it's not the real answer.
The real answer is context. A codebase is a self-contained world. Point an agent at a repo and every fact it needs is already there. Types tell it what things are. Tests tell it what things should do. Imports tell it how things connect. Git history tells it why things changed. Without anyone intending it, programmers built a complete ontology: a machine-readable map of a small universe, its entities, their relationships, and the rules governing them.
But it gets better. A codebase also comes with a labeled training set. A Jira ticket is a prompt: here's what I want, here's the acceptance criteria. A merged pull request is the approved output: here's the correct response, reviewed by a human. Thousands of these pairs, generated organically over years, sitting right there in the issue tracker and git log.
The same labeled pairs exist in every profession. An analyst's inbox is full of "MD asked for a model, here's the version that went to the client." A lawyer's email history contains "client asked a question, partner approved this answer." The training data is everywhere. It's just not anywhere a machine can reach it. Yet.
Context is what makes agents smart regardless of the model underneath. Give an agent complete context and a mediocre model will outperform a frontier model running blind. This is what the benchmarks miss. They test capability in a vacuum. Production tests capability with whatever context you can scrounge together.
In the enterprise, context is a disaster.
We spent the last fifteen years buying SaaS. Hundreds of tools, each best-in-class at one thing. Gong for calls. HubSpot for campaigns. Salesforce for pipeline. Zendesk for tickets. Amplitude for usage. Jira for feature requests. Stripe for payments. Google Analytics for acquisition. Notion for strategy docs.
Then there's the stuff that doesn't fit neatly into any tool. The Slack thread where your team debated whether to give a customer a discount. The email the CEO sent personally after a rough QBR. The offhand comment on a Zoom that changed the product roadmap. All of it is customer data. Almost none of it is reachable.
So what would it take to give an enterprise agent the same complete picture a codebase gives a coding agent?
Every piece of data in a business connects back to one of two things: a customer or an employee. That's it. Pipeline, revenue, support tickets, campaign performance, churn analysis: customer. Payroll, provisioning, compliance, headcount: employee. Every SaaS tool in the stack is a different view of data that ultimately joins on one of these two keys.
At a high level, a business does two things: get new customers and serve existing ones. There is no third thing. Finance exists to measure it. Product exists to enable it. Marketing exists to drive it. Strategy exists to direct it. Every function, every workflow, every decision traces back to the customer.
Now here's the problem. Everyone assumed Salesforce was the customer ontology. The system of record. The source of truth.
It isn't. 80% of customer data lives outside the CRM. Salesforce has deal stages and whatever a rep logs after a call. The actual customer relationship, what they said on the discovery call, what frustrated them in onboarding, which feature they begged for, why they almost churned, lives in Gong, Zendesk, Slack, email, product analytics. Salesforce is a scoreboard. It tells you the score. It can't tell you how the game was played or what to do next.
A scoreboard is not an ontology.
But the raw material for a real customer ontology already exists. The calls are recorded. The emails are logged. The support tickets are timestamped. The product usage is streaming. The data is in the cloud, scattered across dozens of systems, waiting to be unified.
Whoever gathers all of the data about acquiring and serving customers into a single, machine-readable graph builds the codebase equivalent for the rest of the business. That's the platform that automates white-collar work. Not because of a better model. Because of a better ontology.
Not the model layer. Not the agent layer. The meaning layer.
Some people call this a revenue ontology. We just call it the future of enterprise software.
The Future of AI SDRs: How Lantern's Agentic Approach Solves Pipeline Challenges
AI-powered Sales Development Representatives (SDRs) have seen high churn rates of 50-70%, leading many to call them "the biggest bubble in tech." Yet the core use case remains valid. This article explains why early AI SDR solutions failed and how Lantern's agentic approach is transforming pipeline generation with intelligent automation that works alongside human teams.
What are AI SDRs and why are they important?
AI SDRs are artificial intelligence tools designed to automate sales development tasks including prospecting, personalization, and engagement. Unlike human SDRs, AI SDRs can work 24/7, process vast amounts of data, and scale without additional headcount costs. According to recent data, 65% of organizations now report regularly using generative AI, nearly double from 10 months prior in 2024.
The potential benefits include:
Continuous pipeline generation without human limitations
Consistent outreach across all prospects
Data-driven personalization at scale
Reduced cost per qualified meeting
Ability to experiment with go-to-market strategies rapidly
Why are traditional AI SDRs failing? 3 critical problems
Despite hundreds of millions in venture funding, the first wave of AI SDR tools has fallen short of expectations. Here are the three main reasons:
1. Low-quality data inputs produce low-quality outputs
Traditional AI SDRs rely on generic datasets from sources like LinkedIn and basic CRM data. As MIT researchers confirmed in their 2024 study on LLM performance, "input quality directly correlates with output effectiveness." Without differentiated data sources, these tools simply become automated spam machines.
Key statistic: 75% of C-suite executives who prioritized AI investments reported disappointment with the ROI they've seen.
2. RevOps integration is an afterthought
Sales Operations teams must manage the following challenges with most AI SDR platforms:
Manual data uploads
Complex prompt engineering requirements
Hidden decision-making processes behind algorithms
Difficulty integrating with existing CRM and sales tech stacks
This creates more work for Operations teams rather than streamlining their workflows.
3. Hybrid human-AI workflows create friction
Most organizations don't want fully autonomous AI SDRs handling their entire sales process. When human and AI collaboration is poorly designed, it results in:
Reps needing to manually review and fix low-quality AI outputs
Toggle fatigue from switching between multiple systems
Duplicated work and CRM hygiene issues
Inconsistent customer experiences
The Lantern approach: Agentic pipeline generation
Lantern has developed a new framework for AI-powered sales development that solves these fundamental problems. Our agentic approach focuses on three key areas:
1. Intelligent signal capture and enrichment
Show Image
Lantern's AI agents actively hunt for buying signals across:
Job changes among target buyers
Website visits and engagement
Dark funnel activities (communities, forums, social)
Product usage patterns
News and company developments
What makes Lantern different: Our system automatically integrates first-party, second-party and third-party data sources, creating a comprehensive view of each prospect that generic AI tools cannot match.
"We've seen 67% higher engagement rates when our outreach is based on Lantern's multi-signal approach versus traditional methods," says Jordan Martinez, Head of Sales at TechVantage Solutions.
2. Seamless RevOps orchestration
Show Image
Lantern's AI orchestration capabilities include:
No-code signal prioritization rules
Automatic lead scoring based on multiple factors
Dynamic segmentation that updates in real-time
Integration with your existing CRM and sales tools
Transparent AI decision-making with full audit trails
Key statistic: Organizations using Lantern's orchestration capabilities report 43% less time spent on manual data management and 28% more time on high-value selling activities.
3. Human-AI collaborative workflows
Show Image
Lantern's approach to human-AI collaboration ensures:
AI handles data gathering, enrichment, and initial outreach preparation
Human reps maintain control over final messaging and relationship building
Natural handoffs between automated and manual processes
Continuous improvement through feedback loops
"Lantern doesn't replace our SDRs—it makes them superhuman," explains Sarah Johnson, CRO at DataFlow Systems. "Our reps now handle 3x more qualified conversations per day while delivering more personalized experiences."
Real-world results: The Lantern difference
Organizations implementing Lantern's agentic approach have seen transformative results:
74% increase in pipeline generation in a single quarter (Semgrep case study)
3.2x improvement in meeting conversion rates from cold outreach
41% reduction in cost per qualified opportunity
89% adoption rate among sales teams compared to industry average of 43%
Unlike standalone AI SDR tools, Lantern integrates seamlessly with your existing workflows:
Works within your CRM ecosystem
Augments rather than replaces human expertise
Adapts to your specific go-to-market motion
Provides transparency into AI decisions
Getting started with Lantern's agentic approach
Implementing an effective AI-powered sales development program requires the right foundation. Here are three steps to get started:
1. Audit your current signals and data sources
Identify gaps in your prospect intelligence
Evaluate quality of existing data
Map your customer journey touchpoints
2. Define your human-AI collaboration model
Determine which tasks should be automated vs. human-led
Establish clear handoff processes
Create feedback mechanisms for continuous improvement
3. Measure impact beyond activity metrics
Track pipeline influence, not just activity counts
Measure time savings for sales teams
Calculate ROI based on total pipeline impact
Conclusion: The AI SDR is evolving, not dying
The initial wave of standalone AI SDRs may have disappointed, but the core promise remains valid. With Lantern's agentic approach, organizations can now harness the power of AI for sales development without the drawbacks of first-generation tools.
The future belongs to solutions that seamlessly blend AI capabilities with human expertise, creating a system greater than the sum of its parts. By focusing on signal quality, operational integration, and collaborative workflows, Lantern is defining the next evolution of AI-powered pipeline generation.
Ready to transform your pipeline generation with Lantern's agentic approach? Book a demo or start a free trial today.
FAQ: AI SDRs and Agentic Pipeline Generation
What's the difference between traditional AI SDRs and Lantern's agentic approach?
Traditional AI SDRs focus on automating outreach with generic data. Lantern's agentic approach continuously gathers signals, enriches data, and orchestrates personalized actions based on prospect behavior and needs.
How long does it take to implement Lantern's solution?
Most organizations see value within the first 2 weeks. Full implementation typically takes 4-6 weeks depending on your tech stack complexity.
Does Lantern replace my existing sales development tools?
No. Lantern integrates with your existing CRM, sales engagement platforms, and data sources to enhance their effectiveness rather than replace them.
How does Lantern measure ROI?
Lantern tracks multiple metrics including pipeline generated, meeting conversion rates, time saved by sales teams, and cost per qualified opportunity to provide a comprehensive view of ROI.
Is Lantern suitable for both enterprise and startup sales motions?
Yes. Lantern's flexible approach adapts to different sales motions, from high-volume startup outreach to complex enterprise account-based strategies.
Why Your Active Deals Are Sending Buying Signals You're Missing
When a sales cycle stalls, most teams blame external factors: budget constraints, changing priorities, or competitive pressure. What if the real culprit is simpler and more fixable? What if your prospects are actually signaling their continued interest—but your team is missing these critical signals?
The Invisible Intent Gap in Active Sales Cycles
Most sales teams are laser-focused on traditional engagement metrics: email opens, meeting attendance, and CRM activity. Meanwhile, 70% of actual buying intent signals occur outside these tracked channels, creating a dangerous blind spot for deals already in your pipeline.
Consider this scenario: Your champion hasn't responded to emails in two weeks, but three other stakeholders from the account have visited your pricing page seven times in the past 48 hours. Without this intelligence, your rep might be ready to mark the opportunity as "at risk"—exactly when the buying committee is showing peak interest.
The Three Critical Moments Most Teams Miss
1. The Technical Deep Dive
When technical stakeholders return to product pages after formal demos, it signals serious evaluation. Research shows that 83% of technical validation happens independently, without the sales rep's knowledge.
These self-guided technical explorations often predict deal momentum better than meetings or email interactions. When a prospect's engineering team spends 45 minutes on your API documentation after an initial call, they're not casually browsing—they're validating your solution against requirements.
2. The Price Check Signal
The most revealing signal of all? Return visits to pricing pages. When multiple stakeholders from an active opportunity repeatedly view pricing information, they're typically:
Preparing budget justification
Comparing different tiers or packages
Building internal business cases
Preparing for negotiation
Yet most companies have no visibility into this behavior until it's too late to capitalize on the momentum.
3. The Silent Researcher
A particularly valuable signal comes from what we call "The Silent Researcher"—a stakeholder who never appears on calls but extensively researches your solution. Often, this person is:
The economic buyer who stays behind the scenes
A technical evaluator conducting due diligence
A procurement specialist preparing for negotiations
Without proper intent tracking, these invisible but crucial decision-makers remain undetected throughout the sales process. When they eventually surface with objections or requirements, sales teams are caught completely off-guard.
The Revenue Impact of Missed Signals
The financial consequences of missed intent signals in active opportunities are substantial:
Deal velocity slows by 37% when teams fail to respond to buying intent signals within 24 hours
Win rates decrease by 23% for opportunities where technical stakeholder research goes unnoticed
Deal size shrinks by 18% when pricing exploration signals aren't leveraged for upsell conversations
These aren't small efficiency gains—they represent fundamental revenue leakage in your sales process.
From Reactive to Proactive Opportunity Management
Forward-thinking teams are moving beyond basic pipeline management to dynamic opportunity intelligence. This shift involves:
Comprehensive signal tracking across your entire digital ecosystem
Real-time alerts when key stakeholders engage with critical content
Contextual intelligence that maps engagement to specific buying stages
Prescriptive next steps based on the type and intensity of signals
When a technical stakeholder revisits your security documentation, the ideal response isn't the same as when the economic buyer reviews pricing options. Different signals demand different selling motions.
Lantern's Open Opps Intel: Turning Signal Detection into Revenue
This is precisely why we built Lantern's Open Opps Intel agent. It tracks when contacts from active opportunities interact with your critical selling resources, providing immediate alerts and actionable context to your team.
The agent not only captures the "who" and "what" of engagement but also interprets the buying intent behind each interaction. By analyzing behavioral patterns across the entire buying committee, it helps reps understand:
Which deals show true momentum vs. which are stalling
Which stakeholders are actively researching your solution
Which content is resonating with technical vs. economic buyers
Which objections are likely being researched behind the scenes
Sales teams using Lantern's Open Opps Intel report:
28% acceleration in deal velocity for active opportunities
41% improvement in accurately forecasting deal close dates
19% increase in average deal size through better timing of upsell conversations
From Data to Action: What This Means for Your Team
With proper intent signal detection, your team can transform their selling approach:
1. Timing-Based Outreach
When a prospect shows renewed interest after a period of silence, that's the optimal moment for re-engagement—not the arbitrary "checking in" emails most reps send on a predetermined schedule.
2. Content-Based Personalization
If a technical stakeholder downloads your security whitepaper, your next communication should address those specific concerns—not generic value propositions.
3. Multi-Threaded Engagement
When new stakeholders from an account begin researching your solution, it's time to expand your selling motion to include them—even if your champion hasn't made the introduction.
4. Priority-Based Time Allocation
Not all opportunities deserve equal attention. When multiple stakeholders from an account show intense research activity, that opportunity should immediately rise to the top of your rep's priority list.
Conclusion: The Future of Intent-Based Selling
The most sophisticated sales organizations are no longer simply "working their pipeline"—they're orchestrating precise responses to buyer signals across their entire opportunity landscape.
By implementing Lantern's Open Opps Intel agent, teams gain the ability to:
See exactly which active deals are showing genuine buying momentum
Identify the specific stakeholders actively engaged in the buying process
Understand which content and topics are driving buying decisions
Time their outreach to perfectly align with peaks in buyer interest
In the age of digital buying, the winners won't be those who simply work harder—it will be those who can interpret and act on the intent signals their prospects are already sending.
Interested in learning how Lantern's Open Opps Intel agent can transform your team's ability to capitalize on buying signals from active opportunities? Book a demo today to see the power of AI-driven intent tracking in action.
